Note
Gerald Goegelein submitted his modified version of Fred Nachbaur’s Mandelplot program for publication in SyncWare News. It appears this letter was not published.
2/20/87
Gerald W. Goegelein
18026 N. 41st Place
Phoenix, AZ 85032
Dear Mr. Bent,
Several weeks ago looking for something to do I found myself reading back issues of SyncWare News for articles passed over the first time around. The Mandelbrot Plot program in Volume 3 Number 5 caught my eye. Those who read the article by Mr Nachbaur will remember that the Mandelbrot program creates “computer art”, mathematically created patterns otherwise known as fractals. These are in endless detail, many are very beautiful and many have smaller and smaller detail within themselves to explore. This looked interesting, so I entered the original listing to see how it would work.
After running it on my ZX-81 it became apparent that: 1) the screen display obtained using the “PREVIEW” option bore little resemblance to the printout, and 2) the printout consumed a lot of expensive paper (not to mention the amount of time to do the print!).
These discoveries prompted me to convert the program to run on the 2068 where it would be possible to properly display the picture without printing it. I thought that some of your other readers might enjoy running this on their 2068’s so I have included a listing for you to publish if you wish.
As the author of the program (Mr. Nachbaur) noted, the 2068 does not have enough RAM available to support the 192×192 array. I have changed the array to 160×160 along with all code concerned with the array size. I am using a Spectrumized 2068 and since when running in the SPECTRUM mode you have more RAM available that is what my listing is intended to be used with.You may find it will run fine in the 2068 mode, but I have not tried it that way.
Note: reducing the array has the effect of changing the printout from the 6 strips which were printed by the ZX-81 to 5 strips on the 2068.
A plus from converting to the 2068 is that now you are not limited to the characters used by the ZX-81, but can design your own to make the printout picture look just as you wish. Most of you have your own user defined graphics (UDG) designer programs so I will not go into their creation here. In case you did not read the original article, when you have the array printed ten character/UDGs are used to create the ‘gray scale’ of the picture. Using different characters or UDGs has a great effect on the result and the artistic minded will enjoy the personalized touch which can be achieved this way.
Enter my listing and save it to tape before attempting to RUN it. This is always good practice and in the event of a crash will save loss of all of your work.
UDGs you might want to use should be under letter A thru I inclusive. Your A UDG should be the lightest, that is the least black showing. The I should be completely black, or the darkest. The idea is to create a progressively darker character as you approach ‘I’. These UDGs are then used to create the ‘gray scale’ when printing the hardcopy picture at the end of a run. One of these is selected based on the value of each location in the 160 x 160 array, lower values are the lightest, highest values darker.
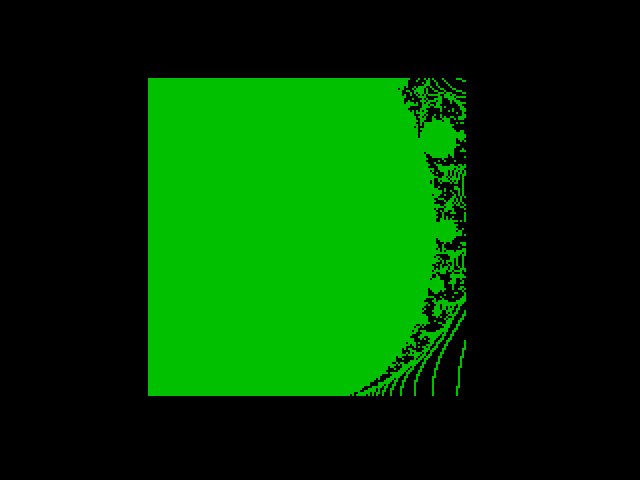
One of my goals in doing this conversion was to be able to see the picture on the screen without the expense (and time) of printing it. Try the PREVIEW option and you will see a close resemblance to the printout with what appears to be elevation lines such as used in a topographical map. I liked the display with the lines as it gives the illusion of depth and visualizes the slopes in the data. Now you can get a good look at the array in a lot less time and possibly be encouraged to explore the Mandelbrot “world” for yourself.
My display is built by scanning the P$ array and using the array address to address a plot position on the screen. The picture is built starting at the lower left hand corner (which I call the origin), scanning across horizontally to the right. Subsequent lines build one above the other until the picture ends up with 160 dots across and 160 lines high.
Deciding whether to plot or not (that is the question!) is critical to how the finished picture will look. I experimented quite a bit to create something which would give you a good representation of what the printout would look like. Line 4030 in my code decides to plot or not, the decision is based on three things. First the slope of the data is tested, if there is a change of 1 between the previous location (one location to the left) a dot will be plotted. The change can be either positive or negative, but must be only by 1. Next the same test is performed in the vertical axis by comparing the data at the current address to that of the point directly below. This is done to produce a consistent display which is insensitive to the orientation of the shapes being represented. Lastly, if the data is 128, the highest possible level, a dot will be plotted.
Try modifying the tests in line 4030 and see how different the result will be. I tried fancy schemes of testing for levels or looking for slopes greater than 1, but after all was said and done ended up with the code you see in the listing. For fun, try changing line 4030 to look for only rising data slope, “IF CODEP$(O,P)>CODE P$(O,P-1) THEN GOTO 4130”. Experiment with testing for other things and see what results.
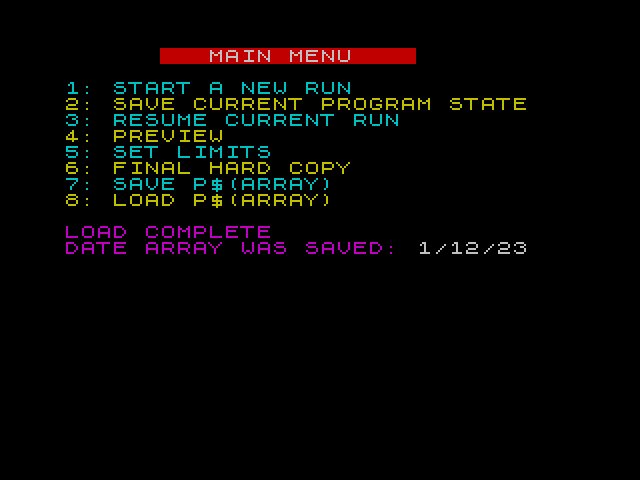
Taking advantage of the ability of the 2068 to save array files I added two options to the Mandelbrot program. Option 7 will save the array, all of the program variables (so you can save in mid run and continue later) and the date to help keep track of multiple files. Option 8 reloads everything and you can pick up where you left off in cases where the array computation was not complete. I did not save the “settings” for the printout thresholds, you may wish to expand on what I did to include them by enlarging the numeric array where the other variables are saved.
One feature I haven’t mentioned is printout of the screen display generated by the PREVIEW option. Have your 2040 printer on and enabled and upon completion of the plotting a copy will be printed along with the coordinates you entered at the start of the run. The current loop count of variables M and N are also printed to let you know where things are in the event you do a PREVIEW before the array computation is completed. Sometimes you can see enough in a partially complete array to know whether or not to let it continue with the current coordinates. When you initially start a run, the coordinates entered will also be printed if the printer is on at that time. This makes a good reference to remind you what numbers you entered.
In exploring the plots I discovered that you can view the whole “world” in one picture. All other features exist within the “world” which you can see with these coordinates: A = -2.1,B = -2.1, S = 4.95. I have not seen any other features outside of this “world” and so far as I know this is all there is with the formulae used in this program. I would like to hear from anyone finding anything outside of this “world” or of modifications to the formulae which generate different “worlds”.
Use the coordinates given in the previous paragraph and print the result. With a ruler draw two lines bisecting the outer circle on the printout. The lines represent the “zero” lines or coordinates for the A-CORNER (horizontal) and B-CORNER (vertical). This can be proved by computing the coordinates of A= 0, B = 0, s = 5. The result will have the lower left hand corner of the picture (the origin) at the intersection of the lines you drew on the first printout. Knowing this will give you a way to navigate around this Mandelbrot “world”. Making the first or “A” coordinate positive moves the origin of the picture to the right of the vertical line, negative to the left. The “B”coordinate works the same way, but this time a positive number moves the origin above the horizontal line on your first picture, a negative number move it below.
With a little practice you can come very close to being where you want to explore in the Mandelbrot world. If you explore around the edges of the “black” areas you will see the canyon lands as I call them. With a little thought you can even draw a grid over the “world” which will help you navigate with some precision.
Once you get the origin of the picture at a interesting point you can magnify the features by using a smaller “S” number. The “S” number is the relative size of the result compared to the Mandelbrot “world”, the smaller number gives you a smaller piece of it to fill the screen.
I hope you have fun with this program and find my modifications useful. If you discover some spectacular sights share the coordinates with SyncWare News and we will all take a look!
By the way, it is possible to speed this program up by compiling it with one of the commercially available compilers. I was successful using TIMACHINE, but this required some restructuring to make it work. One disappointment with the compiled code was that there was little increase in the computation of the array. This code uses the floating point routines in ROM which cannot be speeded up.
I am submitting this for your consideration for publication as an article of general interest. Since I am temporarily unemployed I have time to write other articles if you think these might be useable to you. Specifically I was thinking of writing a follow on to this one showing how to restructure this program for compilation by TIMACHINE. My thought is that a tutorial which shows an example of what must be done plus some easy to understand ways of working around limitations would be interesting to your readers.
Please let me know if you have any interest in my first attempt at a project like this and possibly in further articles.
I enjoy your magazine and hope you can continue producing it for many years to come.
Please note that I have saved each file twice, also note that the Mandelbrot program is to be run on a Spectrumized 2068 (I have ROMSWITCH II) since there is more RAM available.
Sincerely, Gerald W. Goegelein
Document

Heading
Image Gallery