Authors
Publication
Pub Details
Date
Pages
Listings #1 and #2 are shown to illustrate but one point. Both are graphically interesting, though this was not my full intention by including them.
Often what is most important when one does mathematically generated graphics is speed. Many take the 2068 the better part of an hour to produce — a long time to wait if one is testing and debugging formulas. One common trick is to change STEP values in FOR/NEXT loops to larger numbers. This lets a programmer “skip the detail” and more quickly get an idea of the general outcome. For the final version, such values can be altered back so as to show the detail again.
I have found, however, that we tend to overwork our computers when generating graphic displays. The T/S 2068 knows no fatigue. It will calculate cos .4 five thousand times during a graphic without a complaint. But couldn’t the value of cos .4 (.92106099) just as easily have been plugged in and thus saved some time plotting the graphic?
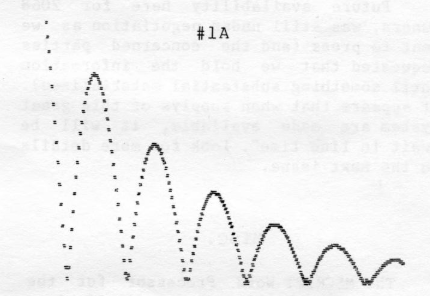
The more calculations the 2068 is forced to do each go, the slower and less appealing our graphic is to watch. Listing #1A produces a “bouncing ball”. Listing #1B does exactly the same thing only less work. Note the math in lines 180 and 190 of listing #1A have been reduced to line 20 of listing #1B. All the variable calculations in lines 10, 20, and 30 of #1A were also eliminated. These should both be run and compared for speed. Listing #1B will go even faster if line 30 is changed to read simply: PLOT x,y.
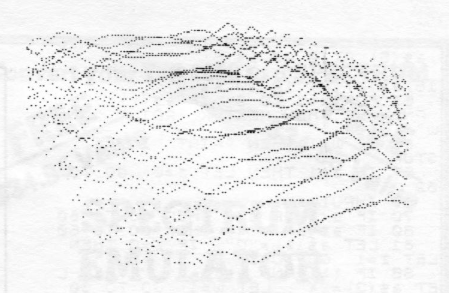
Listings #2A and #2B are mathematically much more complex. Again both produce the same sort of graphic. Listing #2A abounds in variables and is replete with other formula “fat”. Most certainly the formulas in this listing should be worked through and understood by the programmer. In the final version such length is of no use to the computer — simply more code it must wade through. Listing #2B is a version with nearly every calculation trimmed down.
Listing #2B is a fun one for experimentation. The slightest variation will cause differing outcomes. The beauty and the excitement can only be achieved through experimenting, but some examples include:
- Changing the value multiplied by z in line 120 adjusts the height of the topography — .3 is flatter, .8 is steeper, 2.0 is pretty strange. The value 600 shown in lines 100 and 120 can be increased for larger scale, decreased for smaller.
- The value for b in line 90 is negative. The more negative it becomes the more exaggerated the right portion of the display becomes.
- As discussed earlier, a smaller STEP value in line 60, the closer and more detailed the plotting becomes (and slower, too).
One might now take a look back through some old terribly slow graphic programs laying around. One will be amazed at the excess work we have been forcing out of our 2068s. Next time we will look into some even more interesting graphic ideas.
Products
Media
Image Gallery
Source Code
LISTING 1A

    1 REM Bouncing Ball
   10 LET xm=254: LET ym=174: LET h=174
   20 LET w=PI/40: LET d=90*PI/180
   30 LET k=.01
  170 FOR n=0 TO xm-10
  180 LET yn=h*SIN (w*n+d)*EXP (-k*m)
  190 LET yn=ABS (yn)-3
  200 PLOT n+10,yn: PLOT n+10,yn+1: PLOT n+11,yn: PLOT n+11,yn+1
  210 NEXT n

LISTING 1B

    1 REM Bouncing Ball
   10 FOR x=0 TO 253
   20 LET y=174*SIN (.0785*x+1.57)*EXP (-.01*x)
   30 PLOT x,y: PLOT x+2,y: PLOT x+1,y-1: PLOT x+1,y+1
   40 NEXT x

LISTING 2A

   20 LET t=.4: LET j=1.25: LET e=600
   50 FOR a=19 TO -44 STEP -1
   60 FOR b=-35 TO 16
   70 LET z=COS (.06*(a*a+b*b)): LET w=-a*SIN t+b*COS t: LET d=-a*COS t*COS j-b*SIN t*COS j+z*SIN j
  100 LET h=80-a*SIN j*COS t-b*SIN j*SIN t-z*SIN j
  110 LET x=124-e*(w/h)
  120 LET y=96+e*(d/h)
  130 IF y>176 OR y<0 OR x>255 OR x<0- THEN GO TO 200
  140 PLOT x,y
  200 NEXT b
  210 NEXT a

LISTING 2B

    1 REM 2068 Crater
   10 BORDER 1: PAPER 1: INK 7
   20 LET q=-4: CLS
   30 FOR a=23 TO -16 STEP -1.6
   40 IF a>5 THEN LET q=q-1.7
   50 IF a<5 THEN LET q=q+1
   60 FOR b=q TO 15 STEP .3
   70 LET z=COS (.06*(a*a+b*b))
   90 LET h=80-a*.90-b-z
  100 LET x=124-600*((-a*.4+b*.9)/h)
  110 IF x>255 OR x<0 THEN NEXT b
  120 PLOT x,96+600*((-a*.3-b*.1+x*.7)/h)
  130 NEXT b
  140 NEXT a
Note: Type-in program listings on this website use ZMAKEBAS notation for graphics characters.