
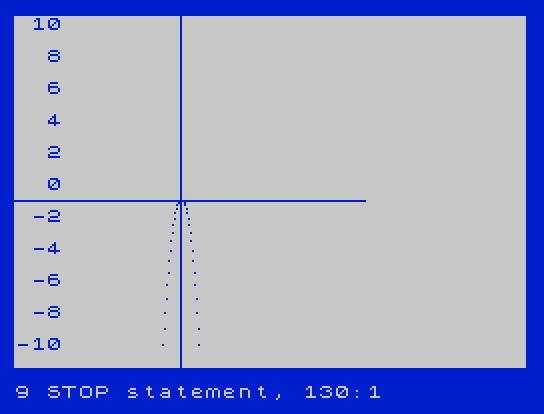
This program plots the parabola y = −x² + x on a coordinate grid drawn directly on the Spectrum’s screen. It first draws horizontal and vertical axes at pixel position 83 using PLOT loops, then prints Y-axis labels from 10 down to −10 in two-unit steps along the left edge, handling alignment for positive, negative, single-digit, and double-digit values with separate PRINT AT statements. The curve is plotted symmetrically by computing both the positive and negative x branches in a single FOR loop stepping by 0.5, offsetting pixel coordinates so the mathematical origin maps to screen position (83, 83). The program uses INK, PAPER, and BORDER attributes for a blue-on-white display.
Program Structure
The program is organized into four distinct phases:
- Initialization: set display attributes and global variable
g(line 1, 5). - Axis drawing: two
FOR/PLOTloops draw a horizontal line at y=83 and a vertical line at x=83 (lines 10–40). - Y-axis label printing: a loop from
f=0to 21 in steps of 2, decrementinggby 2 each iteration, prints numeric labels at the left edge of the screen (lines 46–55). - Curve plotting: a
FOR x=0 TO 9 STEP .5loop evaluatesy=-x^2+xand plots both(x+83, y+83)and(83-x, y+83)to draw both halves of the parabola symmetrically (lines 90–120).
Coordinate System
The mathematical origin is mapped to screen pixel (83, 83). The axes are drawn as straight pixel lines through this point. Because the Spectrum’s pixel Y axis increases upward (unlike screen row addressing), the offset y+83 correctly places positive y values above the axis and negative values below it without any additional inversion.
Parabola Plotting Technique
The curve y = −x² + x is symmetric about x = 0.5, but the program exploits a simpler bilateral symmetry by plotting both x+83 and 83-x for each x value. This means both the right branch (x > 0) and the left branch (x < 0, reflected) are drawn in a single loop pass, halving the number of iterations needed. The loop runs from 0 to 9 in steps of 0.5, giving 19 plot pairs.
Y-Axis Label Alignment
The label printing logic (lines 50–53) manually pads numbers with leading spaces to achieve right-alignment, since BASIC’s PRINT AT does not provide a numeric formatting facility. Four cases are handled:
g = 10: one leading space (line 50)0 <= g < 10: two leading spaces (line 51)-10 < g < 0: one leading space before the minus sign (line 52)g <= -10: no padding needed (line 53)
The variable g is initialized to 12 at line 1 and decremented by 2 at line 48 before the first print, so the first label printed is 10, stepping down to −10 over 11 iterations.
Notable Anomalies and Observations
- The axis loops run from 0 to 175 (lines 10–40), covering most of the 176-pixel-wide Spectrum display width, but the screen is 256 pixels wide and 176 pixels tall. The horizontal axis loop therefore draws only 176 of 256 possible pixels, leaving the right portion of the x-axis undrawn.
- The label loop variable
fsteps from 0 to 21 in steps of 2 (line 46), matching screen character rows 0–21 on the 22-row Spectrum display. However, thePRINT AT f,0calls use the loop variable directly as a row index, so labels are printed on every other character row, corresponding to every two pixel rows of axis spacing. - The condition on line 50 checks
g=10exactly. Sincegdecrements by integer steps of 2 from 12, this will always be hit exactly, so floating-point equality is safe here. STOPat line 130 halts execution cleanly after plotting, preventing a fall-through to theSAVEat line 9998.- The
SAVE "ALGEBRA" LINE 0at line 9998 saves the program with an auto-run directive targeting line 0; since line 0 does not exist, execution will begin at the first available line (line 1) when loaded.
Image Gallery
Source Code
    1 LET g=12
    5 INK 1:PAPER 7:BORDER 1:CLS
   10 FOR c=0 TO 175
   20 PLOT c,83:NEXT c
   30 FOR d=0 TO 175
   40 PLOT 83,d:NEXT d
   45 REM ***********************
   46 FOR f=0 TO 21 STEP 2
   48 LET g=g-2
   50 IF g=10 THEN PRINT AT f,0;" ";g
   51 IF g<10 AND g >=0 THEN PRINT AT f,0;"  ";g
   52 IF g<0 AND g>-10 THEN PRINT AT f,0;" ";g
   53 IF g <=-10 THEN PRINT AT f,0;g
   55 NEXT f
   60 REM ***********************
   90 FOR x=0 TO 9 STEP .5
  100 LET y=-x^2+x
  110 PLOT x+83,y+83
  115 PLOT 83-x,y+83
  120 NEXT x
  130 STOP
 9998 SAVE "ALGEBRA" LINE 0
Note: Type-in program listings on this website use ZMAKEBAS notation for graphics characters.