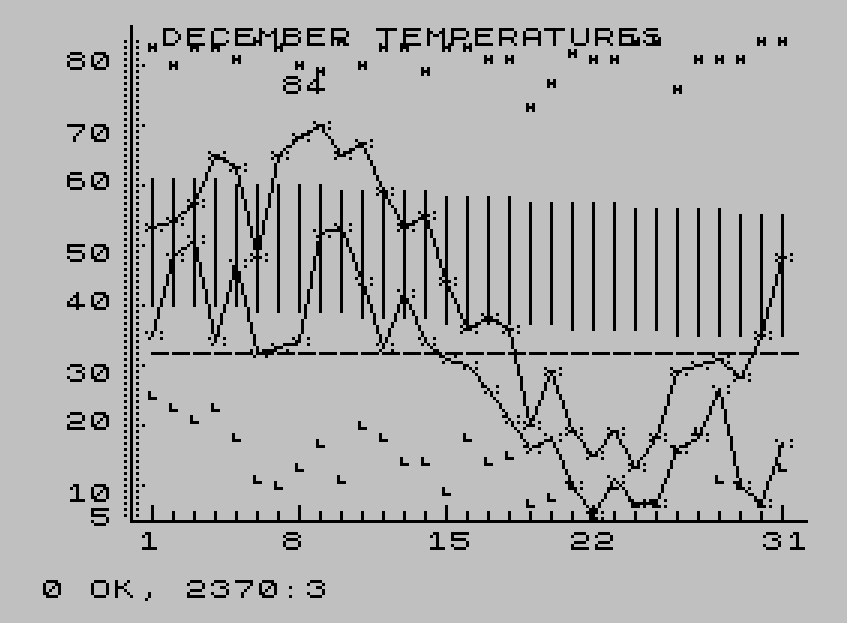
This program plots a December temperature chart for Fort Worth, Texas, drawing axes, gridlines, a freeze line at 32°F, historical average temperature spans, all-time record highs and lows, and the actual daily high/low temperatures for a user-specified year. Data is organised into three separate DATA blocks starting at lines 9000, 9101, and 9201, covering individual year readings (1983–1984), all-time records with the year they occurred, and 30-year average low/high pairs respectively. The chart uses PLOT and DRAW commands exclusively to render the graph within the 256×176 pixel display, scaling temperatures with a factor of 2*(temp+1) to map Fahrenheit values to pixel coordinates. A sentinel value of 0.9 terminates each daily data record, and values above 1000 in the records data are used as year markers that are skipped during reading.
Program Analysis
Program Structure
The program is divided into clearly labelled sections using REM statements, making the intent of each block easy to follow:
- Lines 10–50: Header REMs giving title, authorship, and variable descriptions.
- Lines 1000–1020: User input — current year and year of interest (both entered as two-digit offsets from 1900).
- Lines 2000–2082: Axis drawing, tick marks, temperature labels, and the 32°F freeze line.
- Lines 2100–2140: Plot of the historical average temperature span (low–high bar for each day).
- Lines 2200–2290: Plot of all-time record minimum and maximum temperatures.
- Lines 2300–2390: Plot and line-connect of the selected year’s daily low and high temperatures.
- Lines 9000–9031: Daily temperature DATA for each of the 31 days (two years per line).
- Lines 9100–9131: All-time record DATA — year of record, record low, year of record, record high.
- Lines 9200–9231: 30-year average low/high DATA for each day.
Coordinate System and Scaling
The horizontal axis maps day D to pixel x-coordinate 30 + 7*D, giving 7 pixels per day across a 31-day month. The vertical axis maps a Fahrenheit temperature T to pixel y-coordinate 2*(T+1), so each degree Fahrenheit spans 2 pixels. The baseline is placed at y=10 (corresponding roughly to 4°F), and the axis extends upward 165 pixels to approximately 86°F. Temperature labels at line 2045 are printed at calculated AT positions to align with major gridlines at 5, 10, 20, 30, 40, 50, 60, 70, and 80°F.
DATA Block Organisation
Three separate DATA blocks serve distinct purposes:
| Start Line | Purpose | Format |
|---|---|---|
9000 | Per-day actual temperatures | LO₁, HI₁, LO₂, HI₂, …, 0.9 (sentinel) |
9101 | All-time records | YR_of_min, MIN, YR_of_max, MAX |
9201 | 30-year averages | AVE_LO, AVE_HI |
The daily data at line 9000 stores multiple years’ readings sequentially per line, terminated by the sentinel value 0.9. The program uses RESTORE 9000+D for day D, then skips YRNEW-YR pairs to reach the entry for the desired year — a neat technique that exploits per-line RESTORE targeting.
Sentinel Value Technique
In the record data section (lines 9101–9131), year values (e.g. 1902, 1983) are interspersed among the temperature values. Lines 2230 and 2250 use the check IF X>1000 THEN GO TO 2230 (or 2250) to skip over any year markers encountered while reading, isolating only the temperature values. This allows year annotations to be embedded in the DATA stream without disrupting the temperature-reading loop.
Freeze Line Drawing
A dashed freeze line at 32°F (pixel y = 2*(32+1) = 66) is drawn in lines 2080–2082 using a loop that plots a 5-pixel dash at each day’s x-position, creating a visually distinct dashed line across the chart without resorting to DRAW across the full width.
Record Temperature Marker Style
Record high and low markers (lines 2270–2280) are drawn as bracket-like glyphs using sequences of short DRAW calls relative to a PLOT origin. The pattern DRAW 0,1: DRAW 0,-2: DRAW 0,1: DRAW 2,0: DRAW 0,1: DRAW 0,-2 traces a small vertical tick with a crossbar. This is a compact approach to drawing custom point markers using only DRAW.
Year-Specific Line Graph
Lines 2300–2390 draw connected lines between consecutive days for both the daily high and daily low of the selected year. Variables XHIL, YHIL, XLOL, YLOL cache the previous day’s coordinates, and DRAW XHI-XHIL, YHI-YHIL connects them to the current day. The flag XHIL=0 is used to skip the connecting draw on the very first day, initialising the “last point” variables instead.
Bugs and Anomalies
- Line 9118 anomaly: The DATA entry reads
1964,15,1977,1980,81— there are five values instead of the expected four. The extra value1980will be consumed as the record high temperature for this day (not a year), resulting in an incorrectly plotted record high for December 18th. - Clamping logic: Temperatures below 5°F are clamped to 5 (line 2240) and above 84°F to 84 (line 2260) to keep data within the plotted axes, but no corresponding clamping is applied to the average temperature data in lines 2120–2130, which could theoretically plot outside bounds.
- No validation of YR vs YRNEW: If the user enters a
YRequal to or greater thanYRNEW, the SKIP loop at lines 2320–2340 will either not execute or seek past the sentinel, potentially causing a data error. - Line 9999 as termination target:
GO TO 9999at line 2370 targets a non-existent line, which silently ends program execution — a deliberate and well-known BASIC termination idiom.
Content
Image Gallery
Source Code
   10 REM "TEMP-DEC" © byBen H. Jackson, 1984; ALL RIGHTS RESERVED
   20 REM --FT.WORTH TEMP FOR DEC           BEGINNING 1983
   50 REM --VARIABLES                       YRNEW--THIS YEAR                YR--YEAR OF INTEREST
 1000 CLS : PRINT AT 0,5;"DECEMBER TEMPERATURES"
 1010 INPUT "THIS YR [19XX]=";YRNEW
 1020 INPUT "YR OF INTEREST [19XX]=";YR
 1021 PRINT AT 2,10;YR
 2000 REM --DRAWING OF AXES
 2010 PRINT AT 21,4;"1     8     15    22      31"
 2020 PLOT 30,10: DRAW 225,0
 2025 FOR D=1 TO 31
 2030 PLOT 30+7*D,10: DRAW 0,3
 2031 IF D=1 OR D=8 OR D=15 OR D=22 OR D=31 THEN DRAW 0,2
 2035 NEXT D
 2040 PLOT 30,10: DRAW 0,165
 2045 PRINT AT 20,2;"5";AT 19,1;"10";AT 16,1;"20";AT 14,1;"30";AT 11,1;"40";AT 9,1;"50";AT 6,1;"60";AT 4,1;"70";AT 1,1;"80"
 2050 PLOT 28,12
 2060 FOR I=5 TO 84
 2065 PLOT 28,2*(I+1): PLOT 32,2*(I+1)
 2066 IF I=10 OR I=20 OR I=30 OR I=40 OR I=50 OR I=60 OR I=70 OR I=80 THEN PLOT 34,2*(I+1)
 2070 NEXT I
 2079 REM --DRAWING FREEZE LINE--
 2080 FOR I=1 TO 31
 2081 PLOT 30+7*I,66: DRAW 5,0
 2082 NEXT I
 2100 REM --DRAWING AVE TEMP SPAN
 2110 RESTORE 9201
 2115 FOR D=1 TO 31
 2120 READ ALO: READ AHI
 2130 PLOT 30+7*D,2*(ALO+1): DRAW 0,2*(AHI-ALO)
 2140 NEXT D
 2200 REM --DRAWING MIN,MAX TEMPS
 2210 RESTORE 9101
 2220 FOR D=1 TO 31
 2230 READ X: IF X>1000 THEN GO TO 2230
 2240 LET LO=X: IF LO<5 THEN LET LO=5
 2250 READ X: IF X>1000 THEN GO TO 2250
 2260 LET HI=X: IF HI>84 THEN LET HI=84
 2270 PLOT 29+7*D,2*(HI+1): DRAW 0,1: DRAW 0,-2: DRAW 0,1: DRAW 2,0: DRAW 0,1: DRAW 0,-2
 2280 PLOT 29+7*D,2*(LO+1)+1: DRAW 0,-2: DRAW 2,0
 2290 NEXT D
 2300 REM --DRAW YR'S MIN AND MAX
 2305 LET D=1: LET XHIL=0
 2310 RESTORE 9000+D: LET SKIP=YRNEW-YR
 2320 FOR I=1 TO SKIP
 2330 READ LO: READ HI
 2340 NEXT I
 2345 READ LO: IF LO<5 THEN LET LO=5
 2346 READ HI: IF HI>84 THEN LET HI=84
 2350 PLOT 28+7*D,2*(HI+1)+1: PLOT 33+7*D,2*(HI+1)+1: PLOT 29+7*D,2*(HI+1): DRAW 2,0: PLOT 28+7*D,2*(HI+1)-1: PLOT 33+7*D,2*(HI+1)-1
 2352 LET XHI=30+7*D: LET YHI=2*(HI+1)
 2355 PLOT 28+7*D,2*(LO+1)+1: PLOT 33+7*D,2*(LO+1)+1: PLOT 29+7*D,2*(LO+1)-1: PLOT 33+7*D,2*(LO+1)-1
 2356 LET XST=0
 2358 LET XLO=30+7*D: LET YLO=2*(LO+1)
 2360 IF XHIL=0 THEN LET XHIL=XHI: LET YHIL=YHI: LET XLOL=XLO: LET YLOL=YLO
 2365 PLOT XHIL,YHIL: DRAW XHI-XHIL,YHI-YHIL: PLOT XLOL,YLOL: DRAW XLO-XLOL,YLO-YLOL
 2366 LET XHIL=XHI: LET YHIL=YHI: LET XLOL=XLO: LET YLOL=YLO
 2370 LET D=D+1: IF D=32 THEN GO TO 9999
 2390 GO TO 2310
 9000 REM DATA --FORMAT(DAILY)            DATE;(LO,HI)new,(LO,HI)              (LO,HI),...oldest
 9001 DATA 40,67,35,53,.9
 9002 DATA 48,57,48,54,.9
 9003 DATA 29,54,51,57,.9
 9004 DATA 38,46,34,65,.9
 9005 DATA 33,40,47,63,.9
 9006 DATA 31,43,32,48,.9
 9007 DATA 28,59,33,65,.9
 9008 DATA 38,64,34,68,.9
 9009 DATA 48,74,52,70,.9
 9010 DATA 43,71,53,65,.9
 9011 DATA 46,73,44,67,.9
 9012 DATA 62,70,33,59,.9
 9013 DATA 62,73,42,53,.9
 9014 DATA 43,46,34,55,.9
 9015 DATA 47,72,31,44,.9
 9016 DATA 49,62,30,36,.9
 9017 DATA 56,60,26,38,.9
 9018 DATA 45,52,21,36,.9
 9019 DATA 47,54,16,20,.9
 9020 DATA 51,67,18,29,.9
 9021 DATA 64,68,10,19,.9
 9022 DATA 40,55,05,15,.9
 9023 DATA 40,65,11,19,.9
 9024 DATA 46,71,07,13,.9
 9025 DATA 29,42,07,18,.9
 9026 DATA 43,55,16,29,.9
 9027 DATA 53,61,18,30,.9
 9028 DATA 67,75,26,31,.9
 9029 DATA 64,76,10,28,.9
 9030 DATA 46,64,07,35,.9
 9031 DATA 34,45,17,48,.9
 9100 REM DATA --FORMAT(min,max)          DATE; (YR,MIN),(YR,MAX)
 9101 DATA 1979,25,1950,83
 9102 DATA 1919,23,1951,80
 9103 DATA 1929,21,1970,83
 9104 DATA 1902,23,1977,83
 9105 DATA 1950,18,1951,81
 9106 DATA 1950,11,1966,84
 9107 DATA 1950,10,1922,83
 9108 DATA 1917,13,1977,80
 9109 DATA 1914,17,1906,79
 9110 DATA 1898,11,1983,84
 9111 DATA 1914,20,1938,80
 9112 DATA 1932,18,1973,83
 9113 DATA 1917,14,1933,83
 9114 DATA 1901,14,1933,79
 9115 DATA 1901,09,1908,83
 9116 DATA 1972,18,1908,83
 9117 DATA 1932,14,1908,81
 9118 DATA 1964,15,1977,1980,81
 9119 DATA 1924,07,1978,73
 9120 DATA 1924,08,1978,77
 9121 DATA 1983,10,1981,82
 9122 DATA 1983,05,1964,81
 9123 DATA 1963,10,1964,81
 9124 DATA 1983,07,1955,88
 9125 DATA 1983,07,1955,88
 9126 DATA 1983,16,1971,76
 9127 DATA 1925,19,1925,81
 9128 DATA 1924,11,1921,81
 9129 DATA 1983,10,1923,81
 9130 DATA 1983,07,1951,90
 9131 DATA 1976,13,1951,85
 9200 REM DATA --FORMAT(AVE)              DATE; AVE LO,AVE HI
 9201 DATA 40,61
 9202 DATA 40,61
 9203 DATA 40,61
 9204 DATA 40,61
 9205 DATA 40,60
 9206 DATA 39,60
 9207 DATA 39,60
 9208 DATA 39,60
 9209 DATA 39,60
 9210 DATA 39,59
 9211 DATA 38,59
 9212 DATA 38,59
 9213 DATA 38,59
 9214 DATA 38,59
 9215 DATA 37,58
 9216 DATA 37,58
 9217 DATA 37,58
 9218 DATA 37,58
 9219 DATA 37,57
 9220 DATA 37,57
 9221 DATA 36,57
 9222 DATA 36,57
 9223 DATA 36,57
 9224 DATA 36,56
 9225 DATA 36,56
 9226 DATA 35,56
 9227 DATA 35,56
 9228 DATA 35,56
 9229 DATA 35,55
 9230 DATA 35,55
 9231 DATA 35,55
Note: Type-in program listings on this website use ZMAKEBAS notation for graphics characters.