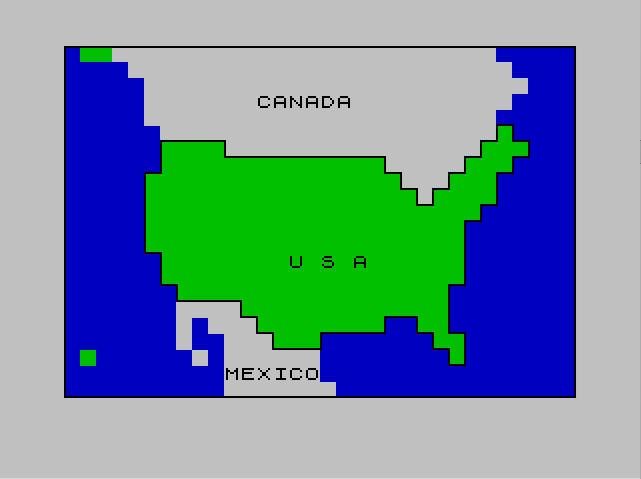
This program displays a color-filled map of North America and then runs a geography quiz asking the user to name U.S. state capitals. The map is built using two techniques: attribute-cell color fills via POKE to the display file starting at address 22528, and a pixel-precise outline drawn with chained PLOT/DRAW commands. Canada and Mexico are rendered in white (PAPER attribute 56), while the United States is rendered in a separate pass using attribute value 32 (green on blue). Country and region labels are printed with PAPER and INK color changes using AT coordinates. The quiz section reads state/capital pairs from DATA statements, accepts INPUT from the user, and compares the response string directly against the stored answer.
Program Analysis
Program Structure
The program is divided into several logical phases controlled by sequential GO TO and GO SUB jumps:
- Lines 10–13: Introduction/dedication message, then
CLS. - Lines 100–390: Set cyan paper background, draw the USA shape by POKEing attribute cells, then
STOP(never reached due toGO TO 500at line 220 when sentinel is hit). - Lines 500–700: Draw Canada and Mexico by POKEing white attribute cells.
- Lines 800–960: Add country/region name labels with colored PAPER/INK, then call subroutine 2000.
- Lines 1000–1060: Border-drawing subroutine using
PLOT/DRAW. - Lines 2000–3030: Pixel-level outline subroutine drawing the continental USA silhouette via chained
DRAWsegments. - Lines 4000–4200: Geography quiz loop — reads state/capital pairs, accepts user input, compares, and reports.
- Lines 4250:
DATAfor the quiz (five state/capital pairs). - Lines 9995–9999:
STOP,SAVE, andVERIFY.
Map Rendering via Attribute POKEs
The filled country regions are created by writing directly to the color attribute file, which begins at address 22528. Each cell corresponds to one 8×8 character position. The formula used is:
P = 22528 + (R * 32) + S
where R is the screen row and S is the starting column. A loop then POKEs L consecutive cells with the chosen attribute byte. The USA uses attribute value 32 (green ink, black paper in standard palette) and Canada/Mexico use 56 (white ink, black paper). This approach fills rectangular runs of cells efficiently without touching the pixel bitmap, so the background color changes appear immediately without any drawing overhead.
DATA Format for Map Fills
Each country’s fill data is a sequence of triplets R, S, L — row, start column, and length — terminated by the sentinel 100, 100, 100. The same READ/sentinel loop pattern is used twice (lines 210–280 for the USA, lines 510–570 for Canada/Mexico), making the structure consistent and easy to extend. Note that line 365 contains the triplet 19,0,1,0,0,3, which is actually two triplets concatenated on one line: 19,0,1 and 0,0,3 — the latter POKEs row 0, column 1 through 3, adding a small fill at the very top of the screen.
Pixel Outline Subroutine (Lines 2000–3030)
Subroutine 2000 draws a detailed pixel-level silhouette of the continental USA coastline using a long sequence of horizontal and vertical DRAW commands (all movements are multiples of 8 pixels, aligning to character cell boundaries). The outline starts at pixel coordinate (48, 128) and proceeds clockwise around the map shape. A PAUSE 100 at line 3025 gives a brief pause before returning, letting the user see the completed outline. INK 0 is set at line 2005 so the outline is drawn in black over the colored attribute cells.
Border Subroutine (Lines 1000–1060)
The screen border is drawn by subroutine 1000 using four DRAW calls from a starting PLOT 0,0 at the bottom-left corner, tracing a rectangle 255 pixels wide and 175 pixels tall — covering nearly the full 256×176 pixel display area.
Geography Quiz Logic
The quiz at line 4000 uses a simple READ/INPUT/IF loop. It reads a state name into A$ and its capital into B$, prompts the user, compares C$ (user input) directly against B$ as a string, and prints feedback. A correct answer loops back via GO TO 4030; an incorrect answer also returns to 4030 after displaying the right answer. When all DATA is exhausted, BASIC will generate an error — there is no explicit end-of-data sentinel, so the quiz terminates with an “Out of DATA” error rather than a graceful message.
Notable Techniques and Idioms
- The blank string
L$=" "(32 spaces) at line 4040 is used to erase previously printed lines by overwriting them, a standard screen-clearing trick for partial rows. PAPERandINKstatements are used inline beforePRINTto change colors for individual labels without needing separate attribute POKEs.- The map-drawing data is split across multiple
DATAlines (300–370 for USA, 605–700 for Canada/Mexico) but both data sets are read sequentially from the same data pointer, relying on BASIC’s single sharedREADpointer and the sentinel value to switch between regions. - Line 390 contains a
STOPthat is never reached during normal execution (flow goes to line 500 via the sentinel branch at line 220), serving as a defensive measure.
Bugs and Anomalies
| Location | Issue |
|---|---|
| Line 4250 | Only five state/capital pairs are in the DATA. The quiz loop has no end-of-data guard, so it will crash with an error after exhausting all entries. |
| Line 4250 | “BIRMINGHAM” is listed as the capital of Alabama; the actual capital is Montgomery. This is a factual error in the quiz data. |
| Line 4160 | PRINT AT 21,0;L$ and PRINT AT 3,0;L$ attempt to clear rows 21 and 3 after showing the answer, but row 3 is also used at line 4100 for “YOUR ANSWER WAS:” — timing of these clears may cause visual glitches depending on PAUSE durations. |
| Lines 100–130 | The comment says “sets map background color to cyan” but PAPER 1 is blue, not cyan (cyan is PAPER 5). The comment is incorrect. |
Content
Image Gallery
Source Code
    1 REM █████████████████
    2 REM ███ GEOGRAPHY ███
    3 REM █████████████████
   10 PRINT " TO THE L.I.S.T. GROUP::::"
   11 PRINT ,,;"HERE IS ONE I'VE BEEN WORKING   ON."
   12 PAUSE 1000
   13 CLS
   14 REM DELETE 10,14
  100 REM SETS MAP BACKGROUND COLOR TO CYAN
  130 PAPER 1
  140 FOR Q=1 TO 22
  150 PRINT "                                "
  160 NEXT Q
  170 REM DRAW BORDER AROUND SCREEN
  180 GO SUB 1000
  200 REM DRAW THE USA IN GREEN
  210 READ R,S,L
  220 IF R=100 THEN GO TO 500
  230 LET P=22528+(R*32)+S
  240 FOR Q=1 TO L
  250 POKE P+Q,32
  260 NEXT Q
  270 REM
  280 GO TO 210
  300 REM DATA FOR PLOTTING USA
  310 DATA 5,26,1,6,5,4,6,25,3
  320 DATA 7,5,14,7,24,3,8,4,16,8,23,3
  330 DATA 9,4,17,9,22,4,10,4,21
  340 DATA 11,4,20,12,4,20,13,5,19,14,5,19
  350 DATA 15,6,17,16,10,13,17,11,8,17,21,2
  360 DATA 18,12,3,18,22,2,19,23,1
  365 DATA 19,0,1,0,0,3
  370 DATA 100,100,100
  390 STOP
  500 REM DRAW CANADA AND MEXICO IN WHITE
  510 READ R,S,L
  520 IF R=100 THEN GO TO 900
  530 LET P=22528+(R*32)+S
  540 FOR Q=1 TO L
  550 POKE P+Q,56
  560 NEXT Q
  570 GO TO 510
  600 REM DATA FOR CANADA AND MEXICO
  605 DATA 0,2,24,1,3,24
  610 DATA 2,4,24,3,4,23,4,4,22,5,5,21,6,9,16,7,19,5,8,20,3,9,21,1
  620 DATA 16,6,4,17,6,1,17,8,3,18,6,1,18,9,3,19,7,1,19,9,6,20,9,6
  630 DATA 21,9,7
  700 DATA 100,100,100
  800 GO SUB 2000
  850 GO TO 4000
  900 REM PUT NAMES ON MAP
  910 PAPER 7
  920 PRINT AT 3,12;"CANADA"
  930 PRINT AT 20,10;"MEXICO"
  940 PAPER 4
  950 PRINT AT 13,14;"U S A"
  960 GO TO 800
  995 REM
 1000 REM DRAW BORDER SUBROUTINE
 1010 PLOT 0,0
 1020 DRAW 255,0
 1030 DRAW 0,175
 1040 DRAW -255,0
 1050 DRAW 0,-175
 1060 RETURN
 2000 REM PLOT OUTLINE
 2005 INK 0
 2010 PLOT 48,128: DRAW 32,0: DRAW 0,-8: DRAW 80,0
 2020 DRAW 0,-8: DRAW 8,0
 2030 DRAW 0,-8: DRAW 8,0: DRAW 0,-8: DRAW 8,0: DRAW 0,8: DRAW 8,0: DRAW 0,8: DRAW 8,0: DRAW 0,8
 2050 DRAW 8,0: DRAW 0,8: DRAW 8,0: DRAW 0,8
 2060 DRAW 8,0: DRAW 0,-8: DRAW 8,0: DRAW 0,-8: DRAW -8,0: DRAW 0,-8: DRAW -8,0: DRAW 0,-16: DRAW -8,0: DRAW 0,-8: DRAW -8,0: DRAW 0,-32
 2070 DRAW -8,0: DRAW 0,-24: DRAW 8,0: DRAW 0,-16: DRAW -8,0: DRAW 0,8: DRAW -8,0: DRAW 0,8: DRAW -8,0
 2090 DRAW 0,8: DRAW -16,0: DRAW 0,-8: DRAW -32,0: DRAW 0,-8
 3000 DRAW -24,0: DRAW 0,8: DRAW -8,0: DRAW 0,8: DRAW -8,0: DRAW 0,8: DRAW -32,0
 3020 DRAW 0,8: DRAW -8,0: DRAW 0,16: DRAW -8,0: DRAW 0,40: DRAW 8,0: DRAW 0,16
 3025 PAUSE 100
 3030 RETURN
 4000 REM GEOGRAPHY QUIZ
 4010 CLS
 4020 GO SUB 2000
 4030 READ A$
 4040 LET L$="                                "
 4100 PAPER 1: INK 7: PRINT AT 9,5;"WHAT IS THE CAPITAL OF";
 4110 PRINT AT 11,7;" ";A$
 4130  READ B$
 4140 INPUT C$
 4150 PAPER 6: INK 0: PRINT AT 2,0;"YOUR ANSWER WAS: ";," ";C$: PAUSE 100
 4160 PRINT AT 20,0;"THE CORRECT ANSWER IS:";," ";B$: PAUSE 100: PRINT AT 21,0;L$: PRINT AT 3,0;L$
 4170 IF C$=B$ THEN PRINT AT 11,7;"    CORRECT   ": PAUSE 200: PRINT AT 11,7;"                 ": GO TO 4030
 4175 PRINT AT 11,7;"      WRONG      ": PAUSE 200: PRINT AT 11,7;"                 "
 4200 GO TO 4030
 4250 DATA "INDIANA","INDIANAPOLIS","CALIFORNIA","SACRAMENTO","WISCONSIN","MADISON","KENTUCKY","FRANKFORT","ALABAMA","BIRMINGHAM"
 9995 STOP
 9998 SAVE "GEOGRAPHY" LINE 1
 9999 CLS : PRINT AT 10,5;"REWIND TO VERIFY": PAUSE 200: VERIFY "GEOGRAPHY"
Note: Type-in program listings on this website use ZMAKEBAS notation for graphics characters.