This program draws a pie chart by plotting dots in polar coordinates, reading wedge definitions from DATA statements at lines 500–540. Each DATA record supplies a dot-density value, a start angle, and an end angle (all in degrees), which are converted to radians internally. The dot density parameter controls both the radial step and the angular step, with the angular increment scaled by 40/r to keep dot spacing roughly uniform across radii. A subroutine at line 400 draws a rectangular border using PLOT/DRAW before the chart is rendered. The program halts when it reads a density value of 0, acting as a sentinel terminator for the DATA list.
Program Structure
The program is divided into four logical sections:
- Introduction (lines 1–4): Displays a description and waits for a keypress via the
INKEY$=""polling loop at line 3. - Main loop (lines 60–330): Sets colours, calls the border subroutine, reads one wedge record, and plots it; then loops back via
GO TO 100(note: line 100 does not exist — see Bugs section). - Border subroutine (lines 410–460): Draws a full-screen rectangle using
PLOT/DRAW. - Data (lines 500–540): Four wedge records plus a sentinel
0,0,0.
Rendering Algorithm
Each wedge is filled by iterating over two nested loops: an outer loop over radius r (from ds to ra in steps of ds) and an inner loop over angle p (from as to ae). The angular step at line 250 is d*(40/r), where d is the density converted to radians. Dividing by r compensates for the increasing arc length at larger radii, keeping dot spacing approximately uniform across the filled area. Each dot is plotted by converting polar (r, p) to Cartesian and offsetting by the centre (xc, yc).
Data Format
| Line | ds (density) | Start angle ° | End angle ° |
|---|---|---|---|
| 500 | 4 | 1 | 70 |
| 510 | 3 | 71 | 200 |
| 520 | 2 | 201 | 300 |
| 530 | 1 | 301 | 360 |
| 540 | 0 | 0 | 0 |
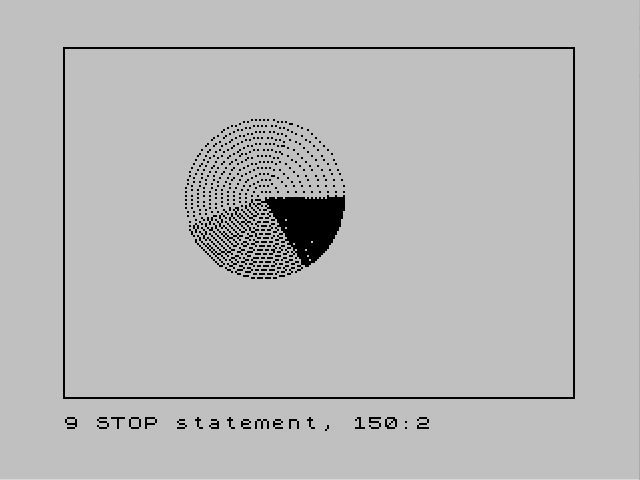
A density of 4 produces the sparsest fill (fewest dots) because both the radial step and the angular step are largest. A density of 1 produces the densest fill. The sentinel record (ds=0) triggers STOP at line 150.
Key BASIC Idioms
IF INKEY$="" THEN GO TO 3— busy-wait keypress loop; noPAUSE 0needed here, though it is less efficient.READ dsthenREAD as,ae— reads from the same sequential DATA pointer across two statements, which is valid but slightly unusual; a singleREAD ds,as,aewould be equivalent.- All angles are stored in degrees in the DATA but immediately converted to radians using
*PI/180, keeping the data human-readable.
Notable Techniques
The angular step formula d*(40/r) at line 250 is an elegant way to achieve roughly constant dot spacing without trigonometric overhead. Since arc length ≈ r·θ, dividing the angular step by r (scaled by a constant 40, matching ra) maintains near-uniform density. The centre coordinates xc=100, yc=100 and radius ra=40 are hardcoded at lines 110–120, placing the chart well within the visible screen area.
Content
Image Gallery
Source Code
    1 REM piechart
    2 PRINT "This program produces a pie     chart from the data that you putin lines 500-540.  The first    number specifies dot density,   the second sets the starting    angle of the wedge, and the     third sets the ending angle.    Press any key to demonstrate."
    3 IF INKEY$="" THEN GO TO 3
    4 CLS
   60 INK 0
   70 PAPER 5
   90 GO SUB 400
  110 LET xc=100: LET yc=100
  120 LET ra=40
  130 READ ds
  140 READ as,ae
  150 IF ds=0 THEN STOP
  210 LET d=ds*PI/180
  220 LET as=as*PI/180
  230 LET ae=ae*PI/180
  240 FOR r=ds TO ra STEP ds
  250 FOR p=as TO ae STEP d*(40/r)
  260 LET x=r*COS (p)
  270 LET y=r*SIN (p)
  280 LET x=x+xc
  290 LET y=y+yc
  300 PLOT x,y
  310 NEXT p
  320 NEXT r
  330 GO TO 100
  410 PLOT 0,0
  420 DRAW 255,0
  430 DRAW 0,175
  440 DRAW -255,0
  450 DRAW 0,-175
  460 RETURN
  500 DATA 4,1,70
  510 DATA 3,71,200
  520 DATA 2,201,300
  530 DATA 1,301,360
  540 DATA 0,0,0
Note: Type-in program listings on this website use ZMAKEBAS notation for graphics characters.