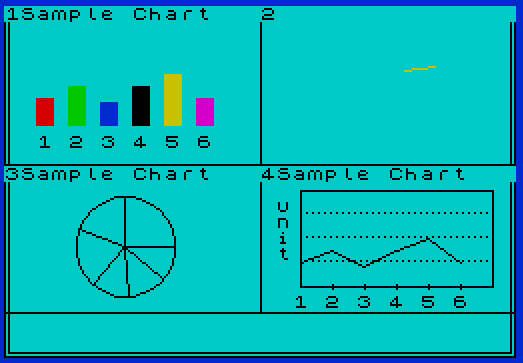
Quadra Chart is a four-window business charting application that simultaneously displays bar charts, color pie charts, line pie charts, and line charts for up to six data points per window.
The program manages four independent data sets stored in parallel arrays (w(), g$(), o(), g()) offset by multiples of six, allowing data to be transferred between windows via a “12 ways data transfer” routine at line 2500.
Multiple machine-code routines are poked into RAM at addresses 50000–50700 to perform fast memory block copies (using the Z80 LDIR instruction, opcode ED B0) between screen memory at 16384 and buffer areas, enabling the quad-window display to be saved and restored without redrawing.
A logarithmic-style scaling system maps data values from 0–999 into pixel heights using piecewise linear segments across eight ranges. The program loads companion code files (“front2s”, “wind”, “line”) and saves itself as a multi-file suite (“loader”, “front2s”, “chart”, “wind”, “line”).
Program Analysis
Program Structure
The listing is actually two separate BASIC programs. The first (lines 5–120) is a bootstrap loader that uses a machine-code LDIR block copy to transfer a saved screen from address 51000 to 16384, then chains to the main “chart” file. The second program (lines 5–9999) is the main application. Key functional blocks are:
- Lines 5–78: Initialization, array declaration, default data setup
- Lines 91–169: Main control loop (user menu)
- Lines 170–195: Window screen dump (machine code)
- Lines 200–425: Total/sort/color assignment (bubble sort + color mapping)
- Lines 500–605: Data input and storage
- Lines 800–850: Screen-clearing utilities
- Lines 900–970: Save window screen (machine code)
- Lines 1000–1350: Bar chart routine (overview and detail)
- Lines 1500–1580: Front screen dump (machine code)
- Lines 1800–2400: Detail bar chart with percentage labels
- Lines 2500–2600: 12-way data transfer between windows
- Lines 3000–3180: Overview pie-drawing routine
- Lines 3600–3960: Per-window redraw dispatchers
- Lines 4500–4560: Pie sector fill sub-routine
- Lines 4800–4930: Restart routine
- Lines 5000–5500: Overview line chart
- Lines 5600–5970: Data assignment from each window’s storage
- Lines 6000–6570: Detail line chart
- Lines 7000–7370: Detail pie chart
- Lines 7400–7970: Data display and editing windows
- Lines 8500–8640: Line pie chart (small pie with lines only, no fill)
- Lines 9000–9060: Redraw after data update
- Lines 9990–9999: Save suite and ON ERR handler
Machine Code Usage
Five separate machine-code snippets are poked into RAM and executed via RANDOMIZE USR. All implement the Z80 LDIR block-copy instruction to move 6912 bytes (a full display file) between screen RAM and buffer areas:
| Address | Source | Destination | Purpose |
|---|---|---|---|
| 50000 | Line 65 DATA / line 6070 DATA | 51000 → 16384 | Restore front screen or line chart background |
| 50200 | Line 190 DATA | 16384 → 58000 (0x40,0x1B / dest 0xE290) | Dump window screen to buffer at 58000 |
| 50300 | Line 960 DATA | 58000 (0xE290) → 16384 | Restore window screen from buffer |
| 50700 | Line 1570 DATA | 16384 → 51000 (0xC738) | Save front screen to buffer at 51000 (approx) |
The machine code pattern is always: LD BC,6912 (01 00 1B), LD DE,dest (11 lo hi), LD HL,src (21 lo hi), LDIR (ED B0), RET (C9) — 12 bytes total. The DATA bytes at line 65 and line 6070 are identical (1,0,27,17,0,64,33,56,199,237,176,201), confirming the same copy direction is reused.
Data Storage Architecture
Four chart windows each store up to six data values. Rather than using two-dimensional arrays, the program uses flat arrays with fixed offsets: window 1 uses w(1)–w(6), window 2 uses w(7)–w(12), window 3 uses w(13)–w(18), and window 4 uses w(19)–w(24). Corresponding label strings are stored in g$() with the same offset scheme. Metadata per window (scale unit, title, data count, starting year/offset) is stored in the scalar arrays f$(), i$(), o(), and g() respectively, indexed 1–4.
Bubble Sort and Color Assignment
Lines 300–425 implement a bubble sort on the percentage array p(), then map sorted positions back to original data indices stored in c(). This assigns distinct INK colors (0–4, skipping 5 which is the PAPER color) to each data segment in the pie charts. The mapping loop at lines 400–420 walks both arrays and increments c(a) when a collision is detected with an already-assigned earlier element, ensuring no two segments share a color.
Logarithmic-Style Bar Scaling
The detail bar chart (lines 2200–2298) and detail line chart (lines 6350–6430) use an identical piecewise linear scaling formula that maps data values in the range 0–999 to pixel heights across eight doubling intervals: 0–15, 15–31, 31–62, 62–124, 124–249, 249–499, 499–999, and ≥999. Each band contributes 16 pixels, giving a total height of 128 pixels. This provides approximately logarithmic visual scaling without using the LOG function, which would be slower and could produce errors for zero values.
Key BASIC Idioms
VAL "number"inPRINT ATandGO TOstatements throughout — a standard memory-saving technique since numeric literals in tokens occupy more space than short strings.VAL "expression"for computed row/column values inPRINT AT, e.g.AT VAL "n+i", VAL "j"andAT VAL "2+n", VAL "10".ON ERR GO TO 9996/ON ERR RESET/ON ERR CONTINUEat lines 5, 10, 9996–9999 for error trapping and recovery.INKEY$polling loops at lines 102–103, 114–120, 132–136 as the primary UI mechanism.INPUT AT VAL "0",VAL "0";...for all data entry, placing the input prompt at the top-left corner.
Pie Chart Drawing
Two pie chart styles are implemented. The overview color pie (lines 3000–3180, sub-routine at 4500–4560) fills sectors by repeatedly plotting and drawing short line segments from the center, iterating over each degree of the sector. The line pie chart (lines 8500–8640) draws only radial division lines with a CIRCLE outline, producing a smaller unshaded version used in window 3. The detail pie chart (lines 7000–7370) uses CIRCLE plus radial DRAW calls and places percentage and label text near each sector using trigonometric positioning.
Bugs and Anomalies
- Line 500 is missing from the listing (the FOR loop at 505 is referenced by GO TO 500 at line 160), so the data-entry flow skips directly to line 505 — this likely works because line 500 falls between 160 and 505 in line-number order and the interpreter runs the nearest line.
- Lines 800–830 use
VAL "n+i"andVAL "j"as thePRINT ATcoordinates; sincen,i, andjare variables,VALon a variable name string would evaluate the current value of those variables at runtime — this is the intended behavior for parameterized window clearing. - Line 605 contains a logical error: the condition
IF z$<>"y" OR z$<>"n"is always true for any value ofz$, so it unconditionally loops back to 590. In practice this is unreachable since lines 600 already handle the “n” case, but it would trap unexpected input. - Line 850 (
RETURN) is unreachable dead code following the unconditionalRETURNat line 840. - Lines 4110–4150 begin a “Print 4 sets data” section but the logic is incomplete — after the INPUT at line 4150, there is no subsequent use of
k, and execution falls through to the pie-drawing sub-routine at line 4500. - Line 7200 is referenced by
GO TO 7200at line 7167 but does not appear in the listing; execution skips to line 7205, which is likely intentional to bypass the fill step for window 3’s line pie.
Content
Image Gallery


Source Code
    5 CLEAR 49999
   10 LOAD "front2s"CODE 16384,6912
   20 GO SUB 40
   30 GO TO 95
   40 RESTORE 65
   45 FOR n=50000 TO 50000+11
   50 READ a: POKE n,a: NEXT n
   60 RANDOMIZE USR 50000
   65 DATA 1,0,27,17,56,199,33,0,64,237,176,201
   80 RETURN
   95 LOAD "chart"
  100 STOP
  110 SAVE "loader" LINE 5
  120 SAVE "front2s"CODE 51000,6912
    5 FLASH 0: ON ERR GO TO 9996: GO TO 17
   10 CLEAR 49999 : ON ERR GO TO 9996
   11 GO SUB 1500
   12 LOAD "wind"CODE 58000,6912
   13 GO SUB 1500
   14 LOAD "line"CODE 51000,6912
   17 PAPER 5: CLS : GO SUB 45
   18 ON ERR GO TO 9996: FLASH 0
   20 BORDER 1: PAPER 5: INK 0
   24 PRINT AT VAL "0",VAL "7";"COLOR QUADRACHART"
   28 PRINT AT VAL "3",VAL "1";"QUADRACHART is a four-window   view of graphical data. A bar   chart, color  pie, line pie and line chart can be displayed in  the chart window or in detail."
   44 INK 0: PAPER 5: BORDER 1: GO TO 91
   45 REM \'.\'.\'. Declare Arrays \'.\'.\'.
   46 DIM y(8): DIM r(8): DIM z(8): DIM i$(4,15): DIM e$(6,2): DIM g$(30,2): DIM f$(4): DIM o(4): DIM g(4): DIM s(8): DIM w(30)
   47 LET a$="m": LET q=6: LET f=75
   48 RESTORE 56
   50 FOR n=1 TO q
   51  LET e$(n)="n": LET g$(n)="n"
   52  READ s(n)
   53   LET e$(n)="nt": FOR m=0 TO 18 STEP 6: LET w(n+m)=s(n): LET g$(n+m)=e$(n): NEXT m
   54 NEXT n
   56 DATA 45,70,40,70,90,45
   57 LET b$="Sample Chart"
   58 FOR n=1 TO 4
   60  LET f$(n)=a$: LET o(n)=q: LET g(n)=f
   62  LET i$(n)=b$
   64 NEXT n
   78 RETURN
   91 REM \'.\'.\'. Control Routine\'.\'.\'.
   98 PRINT AT VAL "10",VAL "1";"The four different charts on   the next screen will demonstratesample data using QUADRACHART."
   99 PRINT AT VAL "18",VAL "9";"\* TIMEX 1983"
  100 FLASH 1: PRINT AT VAL "21",VAL "2";"*** press z to continue ***"
  102 IF INKEY$="z" THEN FLASH 0: GO TO 105
  103 GO TO 102
  105 INK 0: PAPER 5: BORDER 1
  107 GO SUB 170
  110 REM \'.\'.\'. window input \'.\'.\'.
  112 FLASH 1: PRINT AT VAL "20",VAL "1";"i=input,d=detail,a=data,c=copy"
  114 IF INKEY$="i" THEN FLASH 0: GO SUB 840: GO TO 137
  116 IF INKEY$="d" THEN FLASH 0: GO SUB 840: GO TO 130
  117 IF INKEY$="a" THEN FLASH 0: GO SUB 840: GO SUB 900: GO TO 7500
  118 IF INKEY$="c" THEN COPY
  120 GO TO 114
  130 FLASH 1: PRINT AT VAL "20",VAL "1";"which window?(1,2,3 or 4)"
  132 IF INKEY$="1" THEN FLASH 0: GO SUB 5600: GO SUB 900: GO TO 1800
  133 IF INKEY$="2" THEN FLASH 0: GO SUB 5700: GO SUB 900: GO TO 7000
  134 IF INKEY$="3" THEN FLASH 0: GO SUB 5800: GO SUB 900: GO TO 7000
  135 IF INKEY$="4" THEN FLASH 0: GO SUB 5900: GO SUB 900: GO TO 6000
  136 GO TO 132
  137 FLASH 1: PRINT AT VAL "20",VAL "1";"same data another chart?(y/n)"
  139 IF INKEY$="y" THEN GO SUB 840: GO TO 2500
  141 IF INKEY$="n" THEN GO SUB 840: GO TO 146
  142 GO TO 139
  146 LET c$=INKEY$
  148 INPUT AT VAL "0",VAL "0";"which window?(1, 2, 3 or 4)";c$
  150 IF c$<>"1" AND c$<>"2" AND c$<>"3" AND c$<>"4" THEN GO TO 146
  152 LET b$=INKEY$: INPUT AT VAL "0",VAL "0";"give a name(i.e. INVENTORY SALES...etc) ";b$
  154 LET a$=INKEY$: INPUT AT VAL "0",VAL "0";"h=hundred,t=thousand,m=million, b=billion",a$: IF a$<>"h" AND a$<>"t" AND a$<>"m" AND a$<>"b" THEN GO TO 154
  156 INPUT AT VAL "0",VAL "0";"number of input data?(2-6)  ";q: IF q<2 OR q>6 THEN GO TO 156
  158 LET f=0: INPUT AT VAL "0",VAL "0";"Is data consecutive?(y/n)  ";x$: IF x$="y" THEN INPUT AT VAL "0",VAL "0";"enter time(i.e.the first sales  year=75)";f
  160 GO TO 500
  169 STOP
  170 REM \'.\'.\'. Dump Window Screen \'.\'.\'.
  173 RESTORE 190
  175 FOR n=50200 TO 50200+11
  180 READ a: POKE n,a
  185 NEXT n
  187 RANDOMIZE USR 50200
  190 DATA 1,0,27,17,0,64,33,144,226,237,176,201
  195 RETURN
  200 REM \'.\'.\'. Total Sort Corlor \'.\'.\'.
  210 DIM t(5): DIM p(10): DIM c(10)
  213 LET t(1)=0
  215 FOR n=1 TO q
  216  LET z(n)=s(n)
  217  LET t(1)=t(1)+s(n)
  218 NEXT n
  220 FOR n=1 TO q
  230 LET p(n)=INT (360*s(n)/t(1))
  235 LET c(n)=p(n)
  250 NEXT n
  300 REM <<<Bubble Sort>>>
  314 FOR n=1 TO q
  315  FOR m=2 TO q
  320    IF p(m-1)<=p(m) THEN GO TO 340
  325    LET t=p(m-1)
  330    LET p(m-1)=p(m)
  332    LET p(m)=t
  340  NEXT m
  345 NEXT n
  400 FOR a=1 TO q
  405  FOR b=1 TO q
  410    IF c(a)=INT p(b) THEN LET c(a)=b
  411    FOR n=1 TO a-1
  412      IF c(n)=c(a) THEN LET c(a)=c(a)+1
  413    NEXT n
  415  NEXT b
  420 NEXT a
  425 RETURN
  505 FOR n=1 TO q
  510 IF x$="n" THEN INPUT AT VAL "0",VAL "0";"each item name(using 2 letters  i.e.SA=SAles...etc)= ";e$(n): PRINT AT VAL "20",VAL "1";"\  \  \  \  \  \  \  \  \  \  \  "
  512 IF x$<>"y" AND x$<>"n" THEN GO TO 158
  515 INPUT AT VAL "0",VAL "0";"input data(1-999)= ";s(n): IF x$="n" THEN PRINT AT VAL "20",VAL "1";e$(n);"=";s(n)
  520 IF x$="y" THEN PRINT AT VAL "20",VAL "1+4*(n-1)";s(n)
  525 NEXT n
  530 GO SUB 200
  550 REM \'.\'.\'. save data \'.\'.\'.
  560 IF c$="1" THEN FLASH 0: LET f$(1)=a$: LET i$(1)=b$: LET o(1)=q: LET g(1)=f: FOR n=1 TO q: LET w(n)=s(n): LET g$(n)=e$(n): NEXT n: GO SUB 3600
  565 IF c$="2" THEN FLASH 0: LET i$(2)=b$: LET f$(2)=a$: LET o(2)=q: LET g(2)=f: FOR n=1 TO q: LET w(n+6)=s(n): LET g$(n+6)=e$(n): NEXT n: GO SUB 3700
  570 IF c$="3" THEN FLASH 0: LET i$(3)=b$: LET f$(3)=a$: LET o(3)=q: LET g(3)=f: FOR n=1 TO q: LET w(n+12)=s(n): LET g$(n+12)=e$(n): NEXT n: GO SUB 3800
  575 IF c$="4" THEN FLASH 0: LET i$(4)=b$: LET f$(4)=a$: LET o(4)=q: LET g(4)=f: FOR n=1 TO q: LET w(n+18)=s(n): LET g$(n+18)=e$(n): NEXT n: GO SUB 3900
  590 INPUT AT VAL "0",VAL "0";"same numbers another chart?(y/n)";z$
  595 IF z$="y" THEN INPUT AT VAL "0",VAL "0";"which one?";c$: GO TO 560
  600 IF z$="n" THEN GO SUB 840: GO TO 110
  605 IF z$<>"y" OR z$<>"n" THEN GO TO 590
  800 INK 0: PAPER 5: BORDER 1
  810 FOR n=0 TO 8
  820  PRINT AT VAL "n+i",VAL "j";"\  \  \  \  \  \  \  \  \  \  \  \  \  \  "
  830 NEXT n
  840 FLASH 0: PRINT AT VAL "20",VAL "1";"\  \  \  \  \  \  \  \  \  \  \  \  \  \  \  \  \  \  \  \  \  \  \  \  \  \  \  \  \  \  ": RETURN
  850 RETURN
  900 REM \'.\'.\'. Save window screen \'.\'.\'.
  910 RESTORE 960
  920 FOR n=50300 TO 50300+11
  930 READ a: POKE n,a
  940 NEXT n
  950 RANDOMIZE USR 50300
  960 DATA 1,0,27,17,144,226,33,0,64,237,176,201
  970 RETURN
  999 STOP
 1000 REM \'.\'.\'. Bar Chart Routine \'.\'.\'.
 1090 DIM b(10)
 1095 DIM z(10)
 1100 LET t=0
 1110 FOR n=1 TO q
 1120  LET t=t+s(n)
 1130 NEXT n
 1140 FOR n=1 TO q
 1150  LET b(n)=s(n)/t
 1155  LET z(n)=b(n)
 1160 NEXT n
 1163 RETURN
 1165 LET i=1
 1170 FOR n=16 TO 16*q STEP 16
 1173  LET y=100*b(i)
 1175 IF i=7 THEN LET y=100*b(i-1)
 1178 IF y>48 THEN LET y=48
 1180  IF c(i)=5 THEN LET c(i)=0
 1185  FOR m=n TO n+8
 1190    PLOT INK c(i);m,116
 1195    BEEP .05,m/4
 1200    DRAW INK c(i);0,y
 1210  NEXT m
 1220  LET i=i+1
 1230 NEXT n
 1300 FOR a=2 TO 2*q STEP 2
 1310  IF f=0 THEN PRINT AT VAL "8",VAL "a";e$((a/2),1)
 1320  IF f<>0 THEN PRINT AT VAL "8",VAL "a";a/2
 1330 NEXT a
 1350 RETURN
 1500 REM \'.\'.\'. Dump front2s \'.\'.\'.
 1510 RESTORE 1570
 1520 FOR n=50700 TO 50700+11
 1530 READ a
 1540 POKE n,a
 1550 NEXT n
 1560 RANDOMIZE USR 50700
 1570 DATA 1,0,27,17,0,64,33,56,199,237,176,201
 1580 RETURN
 1800 REM <<< Detail Bar Chart >>>
 1805 CLS
 1850 GO SUB 200: GO SUB 1000
 1860 IF a$="h" THEN PRINT AT VAL "2",VAL "1";"IN HUNDREDS"
 1865 IF a$="t" THEN PRINT AT VAL "2",VAL "1";"IN THOUSANDS"
 1870 IF a$="m" THEN PRINT AT VAL "2",VAL "1";"IN MILLIONS"
 1875 IF a$="b" THEN PRINT AT VAL "2",VAL "1";"IN BILLIONS"
 2000 REM
 2010 PRINT AT VAL "0",VAL "INT (30-LEN b$)/2";b$
 2050 LET m=999
 2052 FOR n=4 TO 18 STEP 2
 2053 IF n=18 THEN LET m=0: GO TO 2060
 2054 IF m>=100 THEN PRINT AT VAL "n",VAL "2";m
 2055 IF m<100 AND m>=10 THEN PRINT AT VAL "n",VAL "3";m
 2056 IF m<10 THEN PRINT AT VAL "n",VAL "4";m
 2057 PRINT AT VAL "n",VAL "29";m
 2058 LET m=INT (m/2)+1
 2060 NEXT n
 2070 FOR n=40 TO 142 STEP 16
 2072 PLOT 48,n: DRAW 1,0: DRAW -2,0
 2074 PLOT 223,n: DRAW 1,0: DRAW -2,0
 2076 NEXT n
 2100 PLOT 48,143: DRAW 0,-120: DRAW 175,0: DRAW 0,120
 2200 REM
 2205 LET i=1
 2210 FOR n=72 TO 72+24*(q-1) STEP 24
 2220  IF s(i)<15 THEN LET y=s(i)/15*16
 2240  IF s(i)>=15 AND s(i)<31 THEN LET y=16+(s(i)-15)/(31-15)*16
 2250  IF s(i)>=31 AND s(i)<62 THEN LET y=16*2+(s(i)-31)/(62-31)*16
 2260  IF s(i)>=62 AND s(i)<124 THEN LET y=16*3+(s(i)-62)/(124-62)*16
 2270  IF s(i)>=124 AND s(i)<249 THEN LET y=16*4+(s(i)-124)/(249-124)*16
 2280  IF s(i)>=249 AND s(i)<499 THEN LET y=16*5+(s(i)-249)/(499-249)*16
 2285  IF s(i)>=499 AND s(i)<999 THEN LET y=16*6+(s(i)-499)/(999-499)*16
 2290 IF s(i)>=999 THEN LET y=16*7
 2291 IF c(i)=5 THEN LET c(i)=0
 2292  FOR m=n TO n+8
 2293    BEEP .05,m/4
 2294    PLOT INK c(i);m,24
 2296    DRAW INK c(i);0,y
 2298  NEXT m
 2300  IF f<>0 THEN PRINT AT VAL "20",VAL "n/8";f
 2305  IF f=0 THEN PRINT AT VAL "20",VAL "n/8";e$(i)
 2308  LET y1=20-INT (y/8)-3
 2310  IF z(i)=0 THEN LET p1=0: GO TO 2318
 2312  LET p1=INT (100*z(i))
 2314  IF p1=0 THEN LET p1=1
 2318  PRINT AT VAL "y1",VAL "n/8";p1;"%"
 2320  LET i=i+1
 2325  IF f<>0 THEN LET f=f+1
 2330 NEXT n
 2340 IF f<>0 THEN LET f=f-6
 2350 LET j$=INKEY$
 2360 INPUT AT VAL "0",VAL "0";"r=restart, w=window, c=copy ";j$
 2370 IF j$="r" THEN GO TO 4800
 2375 IF j$="w" THEN GO SUB 170: GO TO 110
 2395 IF j$="c" THEN COPY
 2400 GO TO 2350
 2500 REM \'.\'.\'. 12 ways data transfer \'.\'.\'.
 2510 INPUT AT VAL "0",VAL "0";"Change which one?(1,2,3 or 4)";q$
 2515 IF q$>"4" THEN GO TO 2510
 2520 INPUT AT VAL "0",VAL "0";"From where?";r
 2525 IF r>4 THEN GO TO 2520
 2530 IF q$="1" THEN LET g(1)=g(r): LET c$="1": LET f$(1)=f$(r): LET i$(1)=i$(r): LET o(1)=o(r): FOR n=1 TO o(1): LET w(n)=w((r-1)*6+n): LET g$(n)=g$((r-1)*6+n): NEXT n: GO SUB 5600: GO SUB 3600
 2550 IF q$="2" THEN LET g(2)=g(r): LET c$="2": LET f$(2)=f$(r): LET i$(2)=i$(r): LET o(2)=o(r): FOR n=1 TO o(2): LET w(n+6)=w((r-1)*6+n): LET g$(n+6)=g$((r-1)*6+n): NEXT n: GO SUB 5700: GO SUB 3700
 2570 IF q$="3" THEN LET g(3)=g(r): LET c$="3": LET f$(3)=f$(r): LET i$(3)=i$(r): LET o(3)=o(r): FOR n=1 TO o(3): LET w(n+12)=w((r-1)*6+n): LET g$(n+12)=g$((r-1)*6+n): NEXT n: GO SUB 5800: GO SUB 3800
 2590 IF q$="4" THEN LET g(4)=g(r): LET c$="4": LET f$(4)=f$(r): LET i$(4)=i$(r): LET o(4)=o(r): FOR n=1 TO o(4): LET w(n+18)=w((r-1)*6+n): LET g$(n+18)=g$((r-1)*6+n): NEXT n: GO SUB 5900: GO SUB 3900
 2600 GO TO 110
 3000 REM \'.\'.\'.Pie-Drawing Routine\'.\'.\'.
 3100 LET t=0
 3110 FOR n=q TO 1 STEP -1
 3115  PLOT INK 5;192,135
 3120  INK n: IF n=5 THEN INK 0
 3140  LET a=(p(n)/2+t)/180*PI
 3150  LET x=192+12*COS a: LET y=135+12*SIN a: LET l=15: GO SUB 4500
 3160  LET t=t+p(n)
 3170 NEXT n
 3180 RETURN
 3600 REM \'.\'.\'. Change window 1 \'.\'.\'.
 3610 LET i=0: LET j=1
 3620 GO SUB 800
 3630 GO SUB 200
 3640 GO SUB 1000: GO SUB 1165
 3650 PRINT AT VAL "0",VAL "1+(15-LEN i$(1))/2";i$(1)
 3660 RETURN
 3700 REM \'.\'.\'. Change window 2 \'.\'.\'.
 3710 LET i=0: LET j=17
 3720 GO SUB 800
 3730 GO SUB 200
 3740 GO SUB 3000
 3750 PRINT AT VAL "0",VAL "17+(15-LEN i$(2))/2";i$(2)
 3760 RETURN
 3800 REM \'.\'.\'. Change window 3 \'.\'.\'.
 3810 LET i=10: LET j=1: GO SUB 800
 3820 GO SUB 200
 3830 GO SUB 8600
 3850 PRINT AT VAL "10",VAL "1+(15-LEN i$(3))/2";i$(3)
 3860 RETURN
 3900 REM \'.\'.\'. Change window 4 \'.\'.\'.
 3910 LET i=10: LET j=17
 3920 GO SUB 800
 3930 GO SUB 200
 3940 GO SUB 5000
 3950 PRINT AT VAL "10",VAL "17+(15-LEN i$(4))/2";i$(4)
 3960 RETURN
 4100 REM \'.\'.\'. Print 4 sets data \'.\'.\'.
 4110 GO SUB 840: FLASH 1: PRINT AT VAL "20",VAL "1";"d=change data, z=copy"
 4120 IF INKEY$="d" THEN FLASH 0: GO TO 4140
 4125 IF INKEY$="z" THEN FLASH 0: GO TO 110
 4130 GO TO 4120
 4140 GO SUB 840: FLASH 1: PRINT AT VAL "20",VAL "1";"Which window?(1, 2, 3 or 4)"
 4150 GO SUB 840: FLASH 1: INPUT AT VAL "0",VAL "0";"Which one?(1-6)",k
 4500 REM <<<Pie-Drawing Routine>>>
 4510 FOR a=t+6 TO INT (.9*p(n))+t+6
 4520 LET b=a/180*PI
 4530 PLOT x,y
 4540 DRAW l*COS b,l*SIN b
 4550 NEXT a
 4560 RETURN
 4800 REM \'.\'.\'. Restart routine \'.\'.\'.
 4805 GO SUB 45
 4810 GO SUB 170
 4815 FLASH 0: INK 0: PAPER 5: BORDER 1
 4830 LET q=o(1): LET m=0: GO SUB 4900: GO SUB 3600
 4840 LET q=o(2): LET m=6: GO SUB 4900: GO SUB 3700
 4845 INK 0
 4850 LET q=o(3): LET m=12: GO SUB 4900: GO SUB 3800
 4860 LET q=o(4): LET m=18: GO SUB 4900: GO SUB 3900
 4865 GO SUB 900
 4870 GO TO 110
 4900 FOR n=1 TO q
 4910  LET s(n)=w(n+m)
 4920 NEXT n
 4930 RETURN
 5000 REM <<<Line Chart Routine>>>
 5100 PLOT 148,35
 5110 DRAW 0,48: PLOT 148,35: DRAW 96,0
 5120 PRINT AT VAL "12",VAL "17";"u"
 5122 PRINT AT VAL "13",VAL "17";"n"
 5124 PRINT AT VAL "14",VAL "17";"i"
 5126 PRINT AT VAL "15",VAL "17";"t"
 5132 FOR a=48 TO 72 STEP 12
 5136 FOR b=148 TO 244 STEP 3
 5138 PLOT b,a
 5140 NEXT b
 5142 NEXT a
 5144 PLOT 148,83: DRAW 96,0: DRAW 0,-48
 5150 FOR a=228 TO 164 STEP -16
 5152 PLOT a,35: DRAW 0,1: DRAW 0,-2
 5154 NEXT a
 5158 LET m=0
 5160 FOR n=1 TO q
 5162 IF f<>0 THEN PRINT AT VAL "18",VAL "18+m*2";n
 5163 IF f=0 THEN PRINT AT VAL "18",VAL "18+m*2";e$(n,1)
 5164 LET m=m+1
 5166 NEXT n
 5200 REM \'.\'.\'. Line Chart Formula \'.\'.\'.
 5210 LET m=1
 5215 LET y1=INT (35+2*48*s(m)/t(1))
 5220 FOR n=148 TO 228 STEP 16
 5228  LET y2=INT (35+2*48*s(m+1)/t(1))
 5230  IF m=q THEN RETURN
 5238  PLOT n,y1
 5240  IF y2>80 THEN LET y2=80
 5242  DRAW 16,y2-y1
 5246  LET m=m+1
 5248  LET y1=y2
 5250 NEXT n
 5500 RETURN
 5550 REM \'.\'.\'. General Data Assignment \'.\'.\'.
 5600 REM \'.\'.\'. From W1 \'.\'.\'.
 5610 LET a$=f$(1): LET f=g(1)
 5620 LET b$=i$(1): LET q=o(1)
 5630 FOR n=1 TO q
 5640  LET s(n)=w(n): LET e$(n)=g$(n)
 5650 NEXT n
 5660 LET c$="1"
 5670 RETURN
 5700 REM \'.\'.\'. From W2 \'.\'.\'.
 5710 LET a$=f$(2): LET f=g(2)
 5720 LET b$=i$(2): LET q=o(2)
 5730 FOR n=1 TO q
 5740  LET s(n)=w(n+6): LET e$(n)=g$(n+6)
 5750 NEXT n
 5760 LET c$="2"
 5770 RETURN
 5800 REM \'.\'.\'. From W3 \'.\'.\'.
 5810 LET a$=f$(3): LET f=g(3)
 5820 LET b$=i$(3): LET q=o(3)
 5830 FOR n=1 TO q
 5840  LET s(n)=w(n+12): LET e$(n)=g$(n+12)
 5850 NEXT n
 5860 LET c$="3"
 5870 RETURN
 5900 REM \'.\'.\'. From W4 \'.\'.\'.
 5910 LET a$=f$(4): LET f=g(4)
 5920 LET b$=i$(4): LET q=o(4)
 5930 FOR n=1 TO q
 5940  LET s(n)=w(n+18): LET e$(n)=g$(n+18)
 5950 NEXT n
 5960 LET c$="4"
 5970 RETURN
 6000 REM \'.\'.\'. Detail Line Chart \'.\'.\'.
 6002 DIM y(10)
 6004 CLS
 6010 RESTORE 6070
 6015 FOR n=50000 TO 50000+11
 6020  READ a
 6025  POKE n,a
 6030 NEXT n
 6035 RANDOMIZE USR 50000
 6070 DATA 1,0,27,17,0,64,33,56,199,237,176,201
 6080 INK 0: PAPER 5: PAUSE 1
 6100 IF a$="h" THEN PRINT AT VAL "3",VAL "1";"IN HUNDREDS"
 6110 IF a$="t" THEN PRINT AT VAL "3",VAL "1";"IN THOUSANDS"
 6120 IF a$="m" THEN PRINT AT VAL "3",VAL "1";"IN MILLIONS"
 6130 IF a$="b" THEN PRINT AT VAL "3",VAL "1";"IN BILLIONS"
 6140 PRINT AT VAL "0",VAL "INT (30-LEN b$)/2";b$
 6350 FOR n=1 TO q
 6360  IF s(n)<15 THEN LET y(n)=s(n)/15*16
 6380  IF s(n)>=15 AND s(n)<31 THEN LET y(n)=(s(n)-15)/(31-15)*16+16*1
 6390  IF s(n)>=31 AND s(n)<62 THEN LET y(n)=(s(n)-31)/(62-31)*16+16*2
 6400  IF s(n)>=62 AND s(n)<124 THEN LET y(n)=(s(n)-62)/(124-62)*16+16*3
 6410  IF s(n)>=124 AND s(n)<249 THEN LET y(n)=(s(n)-124)/(249-124)*16+16*4
 6420  IF s(n)>=249 AND s(n)<499 THEN LET y(n)=(s(n)-249)/(499-249)*16+16*5
 6425  IF s(n)>=499 AND s(n)<999 THEN LET y(n)=(s(n)-499)/(999-499)*16+16*6
 6430  IF s(n)>=999 THEN LET y(n)=16*7
 6440 NEXT n
 6445 LET i=2
 6450 FOR n=71 TO 71+24*(q-1) STEP 24
 6455  IF f<>0 THEN PRINT AT VAL "21",VAL "n/8-1";f
 6456  IF f=0 THEN PRINT AT VAL "21",VAL "n/8-1";e$(i-1)
 6457  IF n=71+24*(q-1) THEN GO TO 6485
 6460  PLOT n,y(i-1)+20
 6470  DRAW 24,y(i)-y(i-1)
 6480  LET i=i+1
 6485  IF f<>0 THEN LET f=f+1
 6490 NEXT n
 6500 IF f<>0 THEN LET f=f-6
 6510 LET j$=INKEY$
 6520 INPUT AT VAL "0",VAL "0";"r=restart, w=window, c=copy ";j$
 6530 IF j$="r" THEN GO TO 4800
 6540 IF j$="w" THEN GO SUB 170: GO TO 110
 6565 IF j$="c" THEN COPY
 6570 GO TO 6510
 7000 REM \'.\'.\'. Detail Pie Chart \'.\'.\'.
 7002 CLS
 7003 INK 0: PRINT AT VAL "16",VAL "23";"_________"
 7005 GO SUB 1000
 7010 IF a$="h" THEN PRINT AT VAL "3",VAL "29";"HUN"
 7012 IF a$="t" THEN PRINT AT VAL "3",VAL "29";"THO"
 7014 IF a$="m" THEN PRINT AT VAL "3",VAL "29";"MIL"
 7016 IF a$="b" THEN PRINT AT VAL "3",VAL "29";"BIL"
 7030 PRINT AT VAL "0",VAL "INT (30-LEN b$)/2";b$
 7050 REM \'.\'.\'. Print Color Year Sales \'.\'.\'.
 7052 GO SUB 200
 7055 LET t2=0
 7058 LET y1=5
 7060 FOR n=1 TO q
 7061 IF c$="3" THEN GO TO 7066
 7062  IF c(n)=5 THEN LET c(n)=0
 7065  PRINT INK c(n);AT VAL "y1",VAL "24";"\::"
 7066 INK 0: IF f<>0 THEN LET y(n)=f+n-1: PRINT INK 0;AT VAL "y1",VAL "26";y(n)
 7067 IF f=0 THEN PRINT INK 0;AT VAL "y1",VAL "26";e$(n)
 7068 PRINT INK 0;AT VAL "y1",VAL "29";INT s(n)
 7070  LET y1=y1+2
 7075  LET t2=t2+s(n)
 7080 NEXT n
 7085 PRINT AT VAL "17",VAL "22";"TOTAL ";INT t2
 7086 REM \'.\'.\'. data sort \'.\'.\'.
 7088 FOR n=1 TO q
 7090  FOR m=2 TO q
 7092    IF z(m-1)<=z(m) THEN GO TO 7100
 7094    LET temp=z(m-1)
 7096    LET z(m-1)=z(m)
 7098    LET z(m)=temp
 7100  NEXT m
 7102 NEXT n
 7103 REM \'.\'.\'. set pointer \'.\'.\'.
 7104 FOR n=1 TO q
 7106  FOR m=1 TO q
 7108    IF s(n)=z(m) THEN LET r(m)=n: LET z(m)=0: GO TO 7112
 7110 NEXT m
 7112 NEXT n
 7118 CIRCLE 96,87,68: LET t=0
 7120 FOR n=q TO 1 STEP -1
 7125  LET z1=INT (100*p(n)/360)
 7130  LET b=t/180*PI
 7135  LET a=(p(n)/2+t)/180*PI
 7140  PLOT INK 0;96,87
 7150  DRAW INK 0;68*COS b,68*SIN b
 7160  INK n: IF n=5 THEN INK 0
 7165  LET i=96+80*COS a: LET j=87+80*SIN a
 7167 IF c$="3" THEN GO TO 7200
 7170 LET x=96+30*COS a: LET y=87+30*SIN a: LET l=25: GO SUB 4500
 7205 IF INT (j/8)>=20 THEN PRINT INK 0;AT VAL "21-INT (j/8)",VAL "INT (i/8)";z1;"%": PRINT AT VAL "23-j/8",VAL "INT (i/8)";z(n): GO TO 7280
 7210 PRINT INK 0;AT VAL "21-j/8",VAL "INT (i/8)";z1;"%"
 7220 IF f=0 THEN PRINT INK 0;AT VAL "22-j/8",VAL "INT (i/8)";e$(r(n)): GO TO 7280
 7230 PRINT INK 0;AT VAL "22-j/8",VAL "INT (i/8)";y(r(n))
 7280  LET t=t+p(n)
 7290 NEXT n
 7310 LET h$=INKEY$
 7320 INPUT AT VAL "0",VAL "0";"r=restart, w=window, c=copy ";h$
 7330 IF h$="r" THEN GO TO 4800
 7340 IF h$="w" THEN GO SUB 170: GO TO 110
 7365 IF h$="c" THEN COPY
 7370 GO TO 7310
 7400 REM \'.\'.\'. Clean windows \'.\'.\'.
 7410 INK 0: PAPER 5: BORDER 1
 7420 FOR n=1 TO 8
 7430  PRINT AT VAL "n+i",VAL "j";"\  \  \  \  \  \  \  \  \  \  \  \  \  \  "
 7440 NEXT n
 7450 RETURN
 7500 REM \'.\'.\'. Data windows \'.\'.\'.
 7505 LET flag1=0: LET flag2=0: LET flag3=0: LET flag4=0
 7510 LET l$=INKEY$: INPUT AT VAL "0",VAL "0";"Which window?(1,2,3,4)";l$
 7520 IF l$="1" THEN FLASH 0: GO SUB 7600
 7530 IF l$="2" THEN FLASH 0: GO SUB 7700
 7540 IF l$="3" THEN FLASH 0: GO SUB 7800
 7550 IF l$="4" THEN FLASH 0: GO SUB 7900
 7560 GO TO 7930
 7600 LET i=0: LET j=1: GO SUB 7400
 7605 PRINT AT VAL "1",VAL "11";f$(1)
 7610 FOR n=1 TO o(1)
 7620  PRINT AT VAL "2+n",VAL "10";w(n)
 7630  IF g(1)<>0 THEN PRINT AT VAL "2+n",VAL "4";g(1)+n-1: GO TO 7650
 7640  PRINT AT VAL "2+n",VAL "4";g$(n)
 7650 NEXT n
 7660 RETURN
 7700 LET i=0: LET j=17: GO SUB 7400
 7705 PRINT AT VAL "1",VAL "27";f$(2)
 7710 FOR n=1 TO o(2)
 7720 PRINT AT VAL "2+n",VAL "26";w(n+6)
 7730  IF g(2)<>0 THEN PRINT AT VAL "2+n",VAL "20";g(2)+n-1: GO TO 7750
 7740  PRINT AT VAL "2+n",VAL "20";g$(n+6)
 7750 NEXT n
 7760 RETURN
 7800 LET i=10: LET j=1: GO SUB 7400
 7805 PRINT AT VAL "11",VAL "11";f$(3)
 7810 FOR n=1 TO o(3)
 7820  PRINT AT VAL "12+n",VAL "10";w(n+12)
 7830  IF g(3)<>0 THEN PRINT AT VAL "12+n",VAL "4";g(3)+n-1: GO TO 7850
 7840  PRINT AT VAL "12+n",VAL "4";g$(n+12)
 7850 NEXT n
 7860 RETURN
 7900 LET i=10: LET j=17: GO SUB 7400
 7902 PRINT AT VAL "11",VAL "27";f$(4)
 7905 FOR n=1 TO o(4)
 7910  PRINT AT VAL "12+n",VAL "26";w(n+18)
 7915  IF g(4)<>0 THEN PRINT AT VAL "12+n",VAL "20";g(4)+n-1: GO TO 7925
 7920  PRINT AT VAL "12+n",VAL "20";g$(n+18)
 7925 NEXT n
 7927 RETURN
 7930 REM \'.\'.\'. Update data\'.\'.\'.
 7932 GO SUB 840: FLASH 1: PRINT AT VAL "20",VAL "1";"a=chart,n=new,d=data,z=copy"
 7934 IF INKEY$="a" THEN GO TO 9000
 7938 IF INKEY$="n" THEN GO SUB 840: GO TO 7946
 7939 IF INKEY$="d" THEN GO SUB 840: GO TO 7510
 7940 IF INKEY$="z" THEN COPY
 7942 GO TO 7934
 7946 REM \'.\'.\'. change data \'.\'.\'.
 7949 INPUT AT VAL "0",VAL "0";"Which one?(1-6)";n: IF n<1 OR n>6 THEN GO TO 7949
 7950 IF l$="1" THEN GO SUB 840: INPUT AT VAL "0",VAL "0";"The new value= ";w(n): GO SUB 7600: LET flag1=1: GO TO 7930
 7955 IF l$="2" THEN GO SUB 840: INPUT AT VAL "0",VAL "0";"The new value= ";w(n+6): GO SUB 7700: LET flag2=1: GO TO 7930
 7960 IF l$="3" THEN GO SUB 840: INPUT AT VAL "0",VAL "0";"The new value= ";w(n+12): GO SUB 7800: LET flag3=1: GO TO 7930
 7965 IF l$="4" THEN GO SUB 840: INPUT AT VAL "0",VAL "0";"The new value= ";w(n+18): GO SUB 7900: LET flag4=1: GO TO 7930
 7967 IF l$="d" THEN GO SUB 840: GO TO 7930
 7970 FLASH 1: PRINT AT VAL "20",VAL "1";"Invalid input, try again!": GO TO 7946
 8000 FLASH 0: INK 0: PAPER 7: BORDER 7
 8001 STOP
 8500 REM \'.\'.\'. line Pie Chart \'.\'.\'.
 8600 LET t=p(q)
 8602 INK 0
 8605 CIRCLE 60,55,25
 8607 PLOT 60,55: DRAW 25,0
 8610 FOR n=q-1 TO 1 STEP -1
 8615  LET b=t/180*PI
 8620  PLOT 60,55
 8625  DRAW 25*COS b,25*SIN b
 8630  LET t=t+p(n)
 8635 NEXT n
 8640 RETURN
 9000 REM \'.\'.\'. Redraw new data chart \'.\'.\'.
 9005 FLASH 0: INK 0: PAPER 5: BORDER 1
 9010 GO SUB 170
 9020 IF flag1=1 THEN LET q=o(1): LET m=0: GO SUB 4900: GO SUB 3600
 9025 IF flag2=1 THEN LET q=o(2): LET m=6: GO SUB 4900: GO SUB 3700
 9030 IF flag3=1 THEN LET q=o(3): LET m=12: GO SUB 4900: GO SUB 3800
 9035 IF flag4=1 THEN LET q=o(4): LET m=18: GO SUB 4900: GO SUB 3900
 9050 GO SUB 900
 9060 GO TO 110
 9990 SAVE "chart" LINE 10
 9993 SAVE "wind"CODE 58000,6912
 9995 SAVE "line"CODE 51000,6912
 9996 ON ERR RESET
 9997 PAUSE 100
 9998 ON ERR GO TO 9996
 9999 ON ERR CONTINUE
Note: Type-in program listings on this website use ZMAKEBAS notation for graphics characters.