
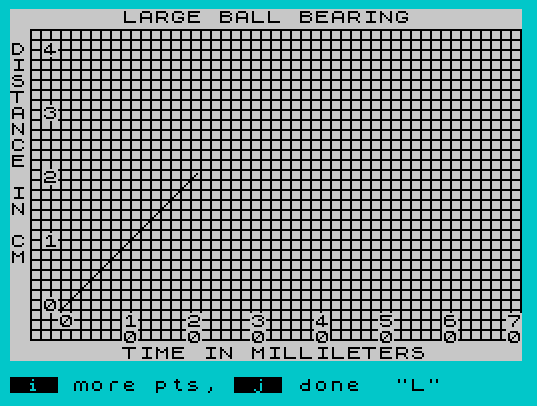
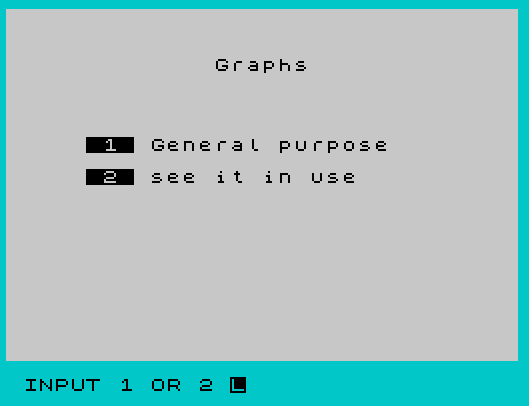
Simple Graph is a two-mode educational graphing utility that draws a grid of horizontal and vertical lines using PLOT and DRAW, then overlays labeled axes and plotted data points. The first mode (lines 20–300) implements a physics demonstration for a “large ball bearing,” plotting distance against time after accepting user INPUT values and scaling them with arithmetic expressions such as `(h/1.25)*4+4` and `(g/.125)*4+4`. A second, standalone graph routine (lines 500–700) uses a different axis-numbering approach, printing labels at column offsets 0, 1, or 2 depending on the number of digits in the value. The menu system at line 1000 sets PAPER, BORDER, and INK attributes before offering the user a choice between the two graph modes, and the program supports COPY for sending the screen to a printer.
Program Structure
The program is organized into four distinct regions:
- Lines 10: Jumps immediately to the menu at line 1000.
- Lines 20–300: The “ball bearing” physics graph — draws the grid, labels both axes, collects Distance/Time pairs via INPUT, plots them, and optionally sends the display to a printer via COPY.
- Lines 500–700: A general-purpose graph routine with its own grid-drawing and axis-labeling loops, ending with a keypress-to-menu prompt using
PRINT #1andPAUSE 0. - Lines 1000–1040: The styled menu, setting PAPER 7, BORDER 5, and INK 9 before printing a selection screen and routing to either routine.
Grid Drawing
Both graph regions draw their grids identically using nested PLOT/DRAW pairs. Vertical lines are drawn first (FOR a=10 TO 255 STEP 5: PLOT a,10: DRAW 0,155), followed by horizontal lines (FOR a=10 TO 165 STEP 5: PLOT 10,a: DRAW 245,0). The result is a fine 5-pixel-pitch graph-paper texture covering most of the screen.
Axis Labeling
The Y-axis labels in the physics graph (lines 80–110) are printed using a simple loop decrementing a row variable d by 4 each step for values 0–5, with a manual fixup at line 110 to correct the “4” label that was skipped. The X-axis labeling (lines 130–210) is more complex, using a chain of conditional IFs to split a two-digit number across two screen rows (tens digit on row 19, units on row 20), simulating a vertical number display.
The general-purpose graph (lines 540–590) attempts a different Y-axis approach, adjusting the print column based on the number of digits in c — column 2 for single digits, column 1 for two digits, column 0 for three digits — though line 570 contains a bug: it tests d >= 100 instead of c >= 100, so the three-digit branch never triggers correctly.
Data Plotting and Scaling
Line 250 plots the data with the expression PLOT 25,25: DRAW (h/1.25)*4+4, (g/.125)*4+4. This scales the user-supplied time h and distance g into pixel coordinates. The DRAW is relative from the fixed origin at (25,25), so all points radiate from that anchor regardless of how many are entered, making this a vector-from-origin plot rather than a connected line graph.
User Interaction Loop
After each data point is plotted, line 260 prompts the user with an inverse-video formatted string asking whether to enter more points (i) or finish (j). Lines 270 accepts either case. After finishing, the user is offered a COPY (line 290) and then a return to the menu via RUN at line 300, which restarts from line 10 and passes through to the menu at 1000.
Notable Anomalies and Bugs
- Line 110 label fix: The loop at lines 80–100 prints values 0–5 at decremented rows, but the step size (4 rows) and range mean the “4” label lands incorrectly; line 110 manually patches it with
PRINT AT 2,2;"4". - Line 220 label typo: The X-axis is labeled
"TIME IN MILLILETERS"— “millileters” is neither a standard unit nor correctly spelled; presumably “milliseconds” was intended. - Line 570 wrong variable: The condition
IF d >=100should beIF c >=100; sincedis a row index (decreasing from 18), it never reaches 100, making the three-digit column-0 print path dead code. - Lines 500–700 incomplete: The general-purpose graph draws the grid and labels axes but has no INPUT or PLOT logic — it ends at line 700 with a menu-return prompt, suggesting the routine is a skeleton or work in progress.
- Loop termination via GO TO: Both axis-labeling loops use
GO TOrather than FOR/NEXT, with sentinel values (e=80at line 200;e<>100at line 680) to break out.
Key BASIC Idioms
- Inverse-video characters in the INPUT prompt at line 260 using
\{20}\{1}and\{20}\{0}escape sequences to highlight option keys. PRINT #1at line 700 writes to the lower display area (stream 1), keeping the graph visible while prompting.RUNat line 300 is used as a soft reset to return to the menu, re-executing theGO TO 1000at line 10.VAL "..."is not used here; all GO TO targets are literal line numbers.
Image Gallery
Source Code
   10 GO TO 1000
   20 REM *****Physics Graph*****
   30 CLS :FOR a=10 TO 255 STEP 5:PLOT a,10:DRAW 0,155:NEXT a
   40 FOR a=10 TO 165 STEP 5:PLOT 10,a:DRAW 245,0:NEXT a
   50 PRINT ''"D"'"I"'"S"'"T"'"A"'"N"'"C"'"E"''"I"'"N"''"C"'"M"
   60 PRINT AT 0,0;"       LARGE BALL BEARING",
   70 REM *****up numbering
   80 LET d=18:FOR c=0 TO 5
   90 PRINT AT d,2;c
  100 LET d=d-4:NEXT c
  110 PRINT AT 2,2;"4"
  120 REM **across numbering
  130 LET e=0:LET f=3
  140 IF e<100 THEN PRINT AT 19,f;e/10
  150 IF e >=100 THEN PRINT AT 19,f; INT (e/100)
  160 IF e>0 AND e<110 THEN PRINT AT 20,f;0
  170 IF e >=110 THEN PRINT AT 20,f;e/10-10
  180 IF e >=100 THEN PRINT AT 21,f;0
  190 LET f=f+4:LET e=e+10
  200 IF e=80 THEN GO TO 220
  210 GO TO 140
  220 PRINT "       TIME IN MILLILETERS",
  230 REM ****plot graph
  240 INPUT "Distance? ";g,"Time? ";h
  250 PLOT 25,25:DRAW (h/1.25)*4+4,(g/.125)*4+4
  260 INPUT "\{20}\{1} i \{20}\{0} more pts, \{20}\{1} j \{20}\{0} done  ";k$
  270 IF k$="i" OR k$="I" THEN GO TO 240
  280 INPUT "k for copy  ";k$
  290 IF k$="k" OR k$="K" THEN COPY
  300 INPUT "Press ENTER for Menu";k$:RUN
  500 REM *****Physics Graph*****
  510 CLS :FOR a=10 TO 255 STEP 5:PLOT a,10:DRAW 0,155:NEXT a
  520 FOR a=10 TO 165 STEP 5:PLOT 10,a:DRAW 245,0:NEXT a
  530 REM *****up numbering
  540 LET c=0:LET d=18
  550 IF c<10 THEN PRINT AT d,2;c
  560 IF c<100 THEN PRINT AT d,1;c
  570 IF d >=100 THEN PRINT AT d,0;c
  580 LET d=d-3:LET c=c+10
  590 IF c <>70 THEN GO TO 550
  600 REM ***across numbering
  610 LET e=0:LET f=3
  620 IF e<100 THEN PRINT AT 19,f;e/10
  630 IF e >=100 THEN PRINT AT 19,f; INT (e/100)
  640 IF e>0 AND e<110 THEN PRINT AT 20,f;0
  650 IF e >=110 THEN PRINT AT 20,f;e/10-10
  660 IF e >=100 THEN PRINT AT 21,f;0
  670 LET f=f+3:LET e=e+10
  680 IF e <>100 THEN GO TO 620
  690 REM ******plot graph
  700 PRINT #1;"Any Key for menu":PAUSE 0
 1000 PAPER 7:BORDER 5:INK 9:CLS
 1010 PRINT ''' TAB 13;"Graphs"'''''"     \{20}\{1} 1 \{20}\{0} General purpose"''"     \{20}\{1} 2 \{20}\{0} see it in use"
 1020 INPUT "INPUT 1 OR 2 ";a:IF a=1 THEN GO TO 500
 1030 IF a=2 THEN GO TO 20
 1040 GO TO 1020
 2000 SAVE "SmpleGraph" LINE 1
Note: Type-in program listings on this website use ZMAKEBAS notation for graphics characters.