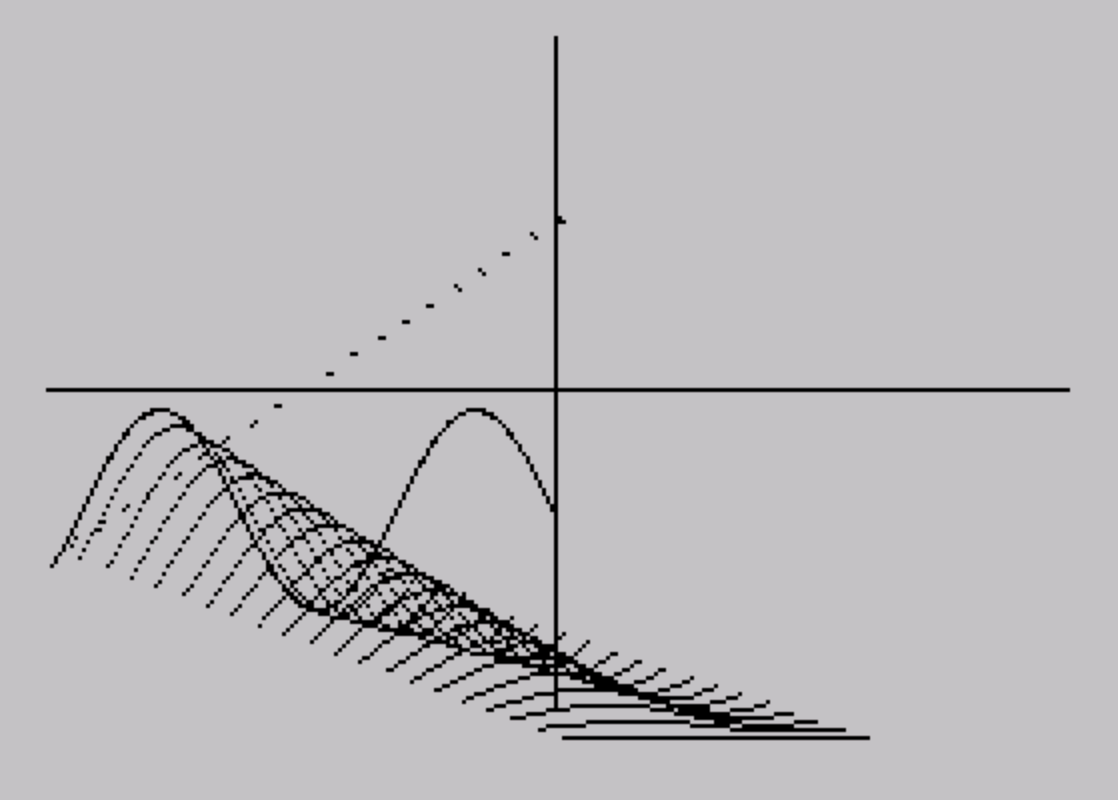
This program draws an interactive 3D surface graph, allowing the user to sketch two cross-sectional curves by holding numeric keys — key 1 for a sine wave, keys 5–9 for various manual gradients — and then renders the surface either south-to-north, west-to-east, or both. The first pass (T=1) collects 127 Y-values into array L(), and the second pass (T=2) collects them into H(), representing the front and back edges of the surface. Projection is achieved by offsetting each drawn line by 128 pixels horizontally and 88 pixels vertically, with the height difference between front and back arrays used to compute the DRAW slope. The west-to-east rendering (lines 200–260) steps across all 127 columns, interpolating each column’s path toward the back in 20 sub-steps of fixed increments plus a proportional height correction. The sine-wave auto-fill routine at line 1000 bypasses manual input by computing B using a running SIN accumulation with a step of 0.04 radians, storing results directly into L().
Program Analysis
Program Structure
The program is divided into four logical phases:
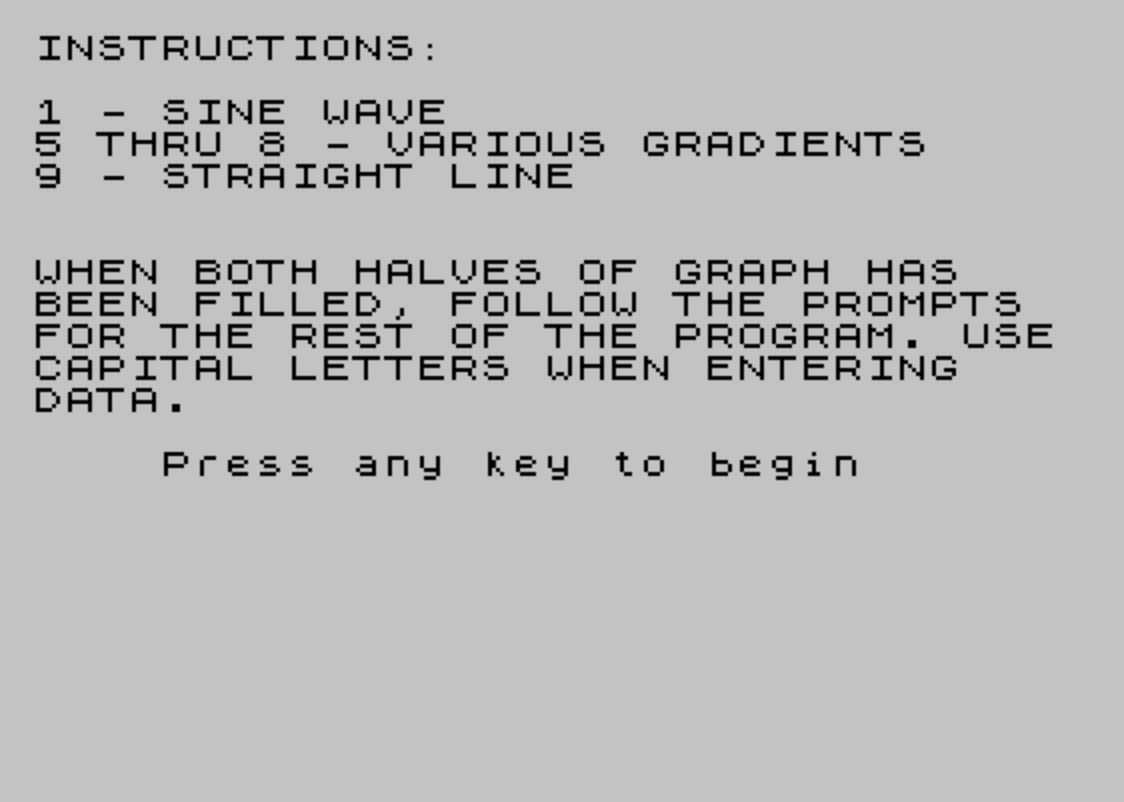
- Setup and instructions (lines 1–9): Display key bindings and wait for a keypress.
- Curve input loop (lines 10–130): Draw the axes, then run a double pass (T=1 and T=2) to collect 127 Y-values for the front curve into
L()and the back curve intoH(). - 3D rendering (lines 145–290): Allow the user to choose south-to-north projection, west-to-east projection, or both, and draw the surface.
- Sine-wave auto-fill (lines 1000–1060): Pre-compute a sine-wave curve into
L()and jump directly to the rendering phase.
Axes and Coordinate System
Line 10 draws the two axes: a vertical line from (127,0) to (127,175) acting as the depth divider, and a horizontal line from (0,87) to (255,87) acting as the horizon. The front half of the display (columns 0–127) holds the first curve pass; the back half (columns 128–255) holds the second. The variable D is used as a horizontal offset: D=-1 for the first pass and D=127 for the second (set at line 130), so PLOT G+D,A correctly places pixels in each half.
Real-Time Curve Drawing
The inner loop (lines 50–115) polls INKEY$ on every iteration and maps each key to a drawing action:
| Key | Effect on A | Description |
|---|---|---|
| 9 | None | Straight horizontal line |
| 8 | A = A + 1 | Steep upward gradient |
| 7 | A = A + 0.5 | Gentle upward gradient |
| 6 | A = A − 0.5 | Gentle downward gradient |
| 5 | A = A − 1 | Steep downward gradient |
| 1 | N/A | Jump to sine-wave auto-fill |
If no key is pressed, line 95 loops back to line 60, effectively spinning until a key is held. This means each pixel column is only plotted when a key is actively depressed, making drawing speed dependent on how long the loop iterates before a key is registered — a deliberate real-time sketching mechanic.
South-to-North Projection (Lines 150–180)
This routine steps through the front-curve array in steps of 4 columns. For each sampled column A, it plots the front point L(A+1) and then issues a single DRAW command to reach the corresponding back point. The DRAW target is offset by 128 pixels right and 88 + ((H(A+1)-88) - L(A+1)) pixels vertically, which computes the signed height difference between the back curve’s deviation from the horizon (88) and the front Y-value. The optional D parameter (entered as radians) passes directly to the DRAW statement’s arc angle, allowing the connecting lines to be drawn as arcs rather than straight segments when a non-zero value is entered.
West-to-East Projection (Lines 200–260)
This routine iterates over all 127 columns and for each column interpolates a path from the front curve point to the back curve point in 20 equal sub-steps. Each sub-step advances A (screen X) by 6.35 and B (screen Y) by 4.4 (a fixed isometric-style offset), plus an additional proportional correction ((H(T+1)-88) - L(T+1)) / 20 to account for the actual height difference between front and back. The 6.35 × 20 = 127 and 4.4 × 20 = 88 products confirm these constants are chosen to span exactly the horizontal half-width and half-height of the display, maintaining a consistent oblique projection angle.
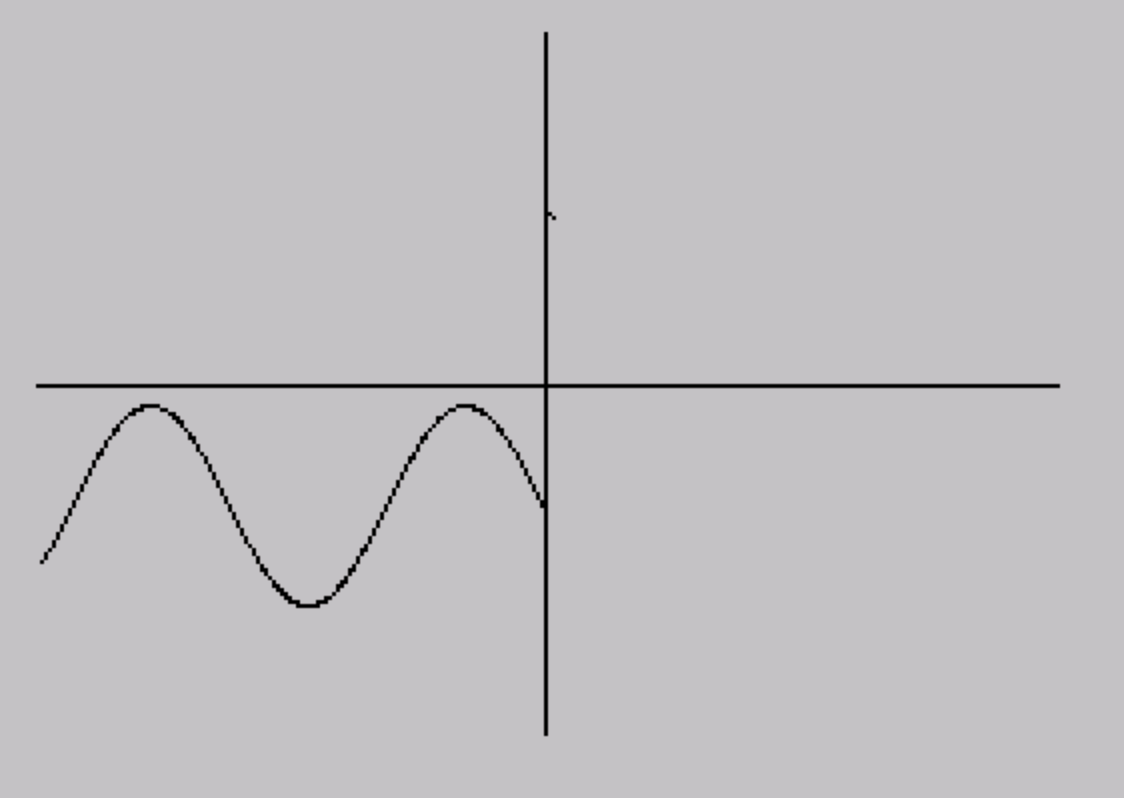
Sine-Wave Auto-Fill (Lines 1000–1060)
Rather than requiring the user to manually draw the front curve, pressing key 1 during the first pass jumps to line 1000. This routine accumulates a sine wave by repeatedly adding SIN(A) to B (starting at Y=43) while incrementing the angle A by 0.04 and the column index D by 0.5 per iteration. Using INT D as the array index and D+0.5 stepping means every other iteration writes to the next integer column, giving 127 samples across columns 1–127. Note that this only fills L() (the front curve); H() is never populated by this routine, so the back curve remains at its initial state (all zeros from DIM H(127)).
Notable Techniques and Idioms
- Using a single variable
Aas the running Y-position across the curve input loop avoids any separate Y-tracking array during drawing. GO TO 130at line 1060 skips the second curve-input pass entirely, meaning projections using the sine wave will have a flat (zero) back curve — a functional but asymmetric result.- The
RUNstatements at lines 192 and 290 restart the entire program (resetting all variables) rather than using a structured loop, which is a common space-saving idiom in short BASIC programs. - Line 130 combines the post-first-pass reset and the outer
NEXT Ton one line, which is valid but unusual formatting.
Bugs and Anomalies
- The sine-wave fill at line 1000 only populates
L(), notH(). After jumping to line 130,H()contains all zeros (the DIM default), so the back curve sits at Y=0 rather than representing a meaningful second cross-section. This will produce a visually odd projection. - In the west-to-east loop (line 200),
Ais used as the screen X accumulator starting from columnT, but it is incremented by 6.35 per sub-step across 20 steps, ending at approximatelyT + 127. For larger values ofT, this will exceed the 255-pixel screen width and cause an out-of-screen PLOT error unless the Spectrum silently clips it. - The prompt at line 270 reads “SOUTH TO EAST AS WELL?” but logically should say “SOUTH TO NORTH AS WELL?” since selecting Y re-triggers the south-to-north rendering path via line 146.
- Array indices use
L(G)andH(G)with G running 1–127, butL(A+1)andH(A+1)in the rendering loops where A steps 0–126 in steps of 4. This correctly accesses indices 1–127, so there is no off-by-one error here.
Content
Image Gallery
Source Code
    1 CLS
    5 REM ***3D*BY*TIM*CLOSS
    6 PRINT "INSTRUCTIONS:": PRINT : PRINT "1 - SINE WAVE": PRINT "5 THRU 8 - VARIOUS GRADIENTS": PRINT "9 - STRAIGHT LINE"
    7 PRINT : PRINT : PRINT "WHEN BOTH HALVES OF GRAPH HAS   BEEN FILLED, FOLLOW THE PROMPTS FOR THE REST OF THE PROGRAM. USECAPITAL LETTERS WHEN ENTERING   DATA.": PRINT : PRINT "    Press any key to begin"
    8 IF INKEY$="" THEN GO TO 8
    9 CLS
   10 PLOT 127,0: DRAW 0,175: PLOT 0,87: DRAW 255,0
   20 DIM L(127): DIM H(127)
   30 LET A=43
   35 LET D=-1
   40 FOR T=1 TO 2
   50 FOR G=1 TO 127
   60 IF INKEY$="9" THEN PLOT G+D,A: GO TO 100
   70 IF INKEY$="8" THEN LET A=A+1: PLOT G+D,A: GO TO 100
   75 IF INKEY$="5" THEN LET A=A-1: PLOT G+D,A: GO TO 100
   80 IF INKEY$="7" THEN LET A=A+.5: PLOT G+D,A: GO TO 100
   90 IF INKEY$="6" THEN LET A=A-.5: PLOT G+D,A: GO TO 100
   91 IF INKEY$="1" THEN GO TO 1000
   95 GO TO 60
  100 IF T=1 THEN LET L(G)=A: GO TO 115
  110 LET H(G)=A
  115 NEXT G
  130 LET A=131: LET D=127: NEXT T
  145 INPUT "(1) SOUTH TO NORTH OR           (2) WEST  TO EAST ?";O
  146 IF O=1 THEN INPUT "RADIANS?";D: GO TO 150
  147 IF O=2 THEN GO TO 200
  148 GO TO 145
  150 FOR A=0 TO 126 STEP 4
  160 PLOT A,L(A+1)
  170 DRAW 128,88+((H(A+1)-88)-L(A+1)),D
  180 NEXT A
  190 INPUT "WEST TO EAST AS WELL?";O$
  191 IF O$="Y" THEN GO TO 200
  192 RUN
  200 FOR T=0 TO 126
  210 LET B=L(T+1): LET A=T
  220 FOR G=1 TO 20
  230 LET A=A+6.35: LET B=B+4.4
  240 LET B=B+((H(T+1)-88)-L(T+1))/20
  245 PLOT A,B
  250 NEXT G
  260 NEXT T
  270 INPUT "SOUTH TO EAST AS WELL?";O$
  280 IF O$="Y" THEN LET O=1: GO TO 146
  290 RUN
 1000 LET B=43
 1010 LET A=1
 1015 LET D=1
 1020 LET L(INT D)=B
 1021 PLOT D,B
 1030 LET B=B+(SIN A)
 1040 LET A=A+.04: LET D=D+.5
 1045 IF D>=127 THEN GO TO 1060
 1050 GO TO 1020
 1060 GO TO 130
Note: Type-in program listings on this website use ZMAKEBAS notation for graphics characters.