
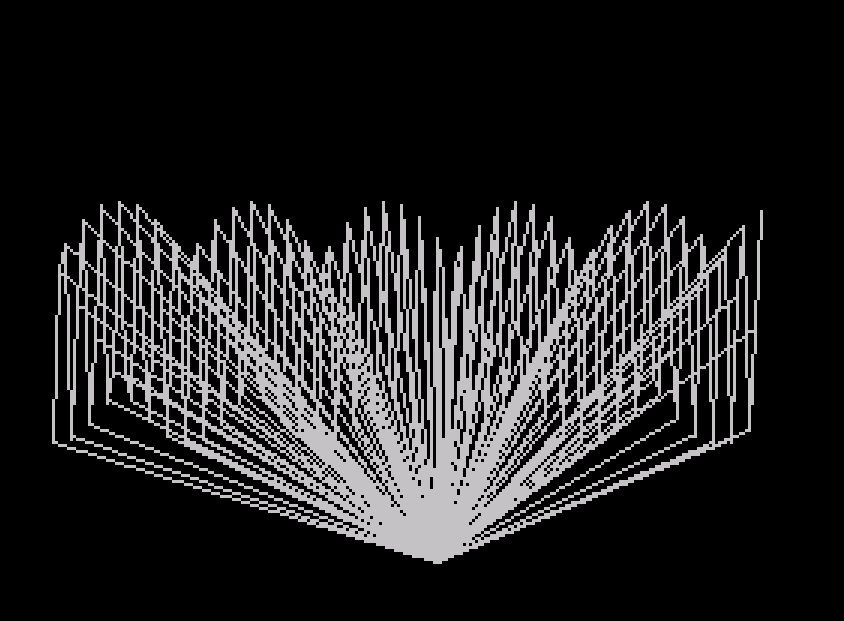
3D-PLOT renders a three-dimensional surface of the function z = 7·e^(−0.1(x²+y²)), a bell-curve-shaped “hat” function, using a perspective projection onto the TS 2068 screen. The plotting routine (lines 30–120) iterates over a grid from x=8 to −8 and y=−8 to 8 in steps of 0.5, applying a full rotation matrix with configurable theta and phi angles (both defaulting to 30°) and a viewing distance parameter. Hidden-line suppression is approximated using a `flag` variable: when a new scanline begins the pen is lifted, and subsequent points are connected with DRAW using PEEK 23677/23678 to read back the current plot coordinates, creating a wire-frame appearance. After a PAUSE, execution jumps to line 300, which displays an animated cosine wave pattern that grows progressively denser by incrementing the step size `i` in a loop, serving as a visual effect between runs.
Program Structure
The program is divided into three logical sections:
- Lines 10–120: Main 3D surface plotting loop, including the function definition and rendering pipeline.
- Lines 130–190: Subroutines — clipping and draw logic (130–150), and initialization (160–190).
- Lines 300–360: A standalone animated cosine-wave display, reached via
GO TO 300after the surface plot completes.
Mathematical Function
Line 10 defines FN z(x,y) = 7*EXP(-.1*(x*x+y*y)), a rotationally symmetric Gaussian (“Mexican hat” without the negative ring), peaking at 7 when x=y=0 and decaying outward. The grid spans x from 8 to −8 (step −1) and y from −8 to 8 (step 0.5), giving 17×33 = 561 sample points.
3D Perspective Projection
Lines 70–100 implement a full rotation and perspective transform. The angles theta and phi (both 30°) are converted to radians and cached as sn1, cn1, sn2, cn2 in the initialization subroutine (line 190), avoiding repeated trigonometric calls inside the loop. The projection equations are:
ye— rotated Y component in eye space (line 70)ze— depth in eye space, offset by distanced=30(line 80)xs— screen X with a 1.2 horizontal stretch and centering at 128 (line 90)ys— screen Y centered at 100 (line 100)
The scale factor s=2 and focal length 420 control the overall zoom. The 1.2 horizontal stretch on xs compensates for the non-square pixel aspect ratio of the display.
Hidden-Line Suppression via Flag and PEEK
The subroutine at lines 130–150 implements a simple hidden-line approximation. A flag variable tracks whether the pen is currently “down.” It is reset to 0 at the start of each x-row (line 40) and also whenever a point falls outside the screen boundary (line 130). The first valid point on a scanline is PLOTted and flag is set to 1 (line 140). Subsequent points are connected using DRAW, with the delta computed as xs - PEEK 23677 and ys - PEEK 23678 (line 150). System variables 23677 and 23678 hold the last PLOT/DRAW coordinates, allowing the program to avoid storing a separate previous-point variable.
Screen Clipping
Line 130 checks all four screen boundaries (xs<0, xs>255, ys<0, ys>175) before attempting to draw, preventing out-of-range PLOT/DRAW errors and resetting the pen flag so a new line segment begins after any gap.
Post-Plot Animation (Lines 300–360)
After a PAUSE 300, execution transfers to line 300 for an animated cosine display. A cosine wave is plotted across the screen width (0–255), and a diagonal line is also drawn from each point toward the center using DRAW 128-d, -80+f. The step variable i starts at 2 and increments by 1 each iteration; after each pass the screen is cleared and the loop restarts, producing a progressively coarser pattern. This section loops indefinitely via GO TO 320.
Key Variables
| Variable | Role |
|---|---|
d | Viewing distance (30) in 3D section; loop counter in cosine section |
theta, phi | Rotation angles (30° each), converted to radians |
sn1/cn1, sn2/cn2 | Cached sin/cos of theta and phi |
s | Scale factor for projection (2) |
flag | Pen-up/pen-down state per x-row |
xs, ys | Projected screen coordinates |
i | Step increment for cosine animation |
Notable Techniques
- Pre-computing all trigonometric values before the nested loop avoids expensive
SIN/COScalls on every iteration. - Using PEEK on the system’s last-plot coordinate variables eliminates the need for explicit previous-point tracking variables.
- The
DEF FNat line 10 encapsulates the surface equation cleanly, making the function easy to substitute. - The dual-use of variable
d(viewing distance in section one, loop counter in section two) is a minor source of potential confusion if the two sections were ever combined differently. - The cosine section uses both
PLOT+DRAWfor the wave and a secondPLOT+DRAWfor a radial line from the same point, creating a distinctive star-burst interference pattern asigrows.
Image Gallery
Source Code
   10 DEF FN z(x,y)=7*EXP (-.1*(x*x+y*y))
   20 GO SUB 160
   30 FOR x=8 TO -8 STEP -1
   40 LET flag=0
   50 FOR y=-8 TO 8 STEP .5
   60 LET z=FN z(x,y)
   70 LET ye=-x*cn1*cn2-y*sn1*cn2+z*sn2
   80 LET ze=-x*sn2*cn1-y*sn2*sn1-z*cn2+d
   90 LET xs=1.2*(((420/s)*((x*sn1+y*cn1)/ze))+128)
  100 LET ys=(-(420/s)*(ye/ze))+100
  110 GO SUB 130
  120 NEXT y: NEXT x: PAUSE 300: RUN 300
  130 IF xs<0 OR xs>255 OR ys<0 OR ys>175 THEN LET flag=0: RETURN
  140 IF flag=0 THEN PLOT xs,ys: LET flag=1: RETURN
  150 DRAW xs-PEEK 23677,ys-PEEK 23678: RETURN
  160 INK 4: PAPER 0: BORDER 0: CLS
  170 LET d=30: LET theta=d: LET phi=d: LET s=2
  180 LET theta=theta*PI/180: LET phi =phi*PI /180
  190 LET sn1=SIN theta: LET sn2=SIN phi: LET cn1=COS theta: LET cn2=COS phi: RETURN
  300 INK 7: PAPER 0: BORDER 0: CLS
  310 LET i=2
  320 FOR d=0 TO 255-i STEP i
  330 LET e=d+i: LET f=40*COS d: LET j=40*COS e
  340 PLOT d,80-f: DRAW i,(80-j)-(80-f)
  350 PLOT d,80-f: DRAW 128-d,-80+f
  360 NEXT d: LET i=i+1: CLS : GO TO 320
Note: Type-in program listings on this website use ZMAKEBAS notation for graphics characters.