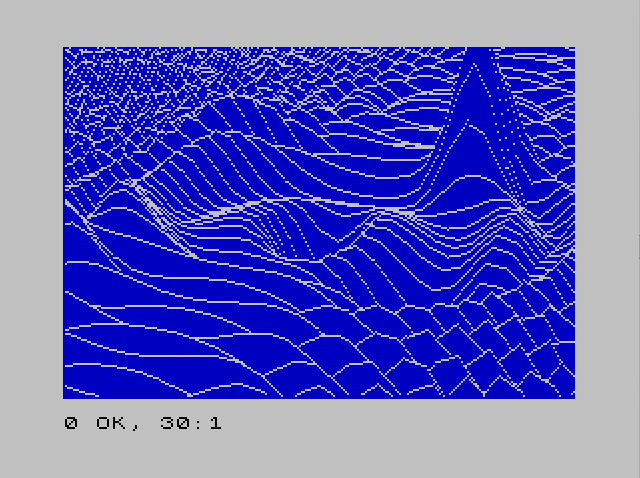
This program renders a three-dimensional surface plot combining cosine and multiple exponential “bump” functions onto the screen using a hidden-line removal technique. The surface function FN Z(X) is the sum of eight component functions (FN G through FN U, FN J), each defined as a Gaussian or cosine expression in the global variables X and Y. A perspective projection converts 3D world coordinates through a rotation defined by angles THETA and PHI into 2D screen coordinates SX and SY, using a distance parameter RHO of 80 and a focal length D of 750. Hidden-line removal is implemented by maintaining two arrays N() and Q() of size 255, tracking the minimum and maximum Y screen positions plotted for each X column, so that only visible surface edges are drawn. The program is a Spectrum BASIC port of an Apple II program from Roy Myers’ “Microcomputer Graphics” book, adapted by James N. Jones of Amarillo, Texas.
Program Analysis
Program Structure
The program is organized into three logical phases: initialization and parameter setup (lines 10–60), the main double-loop over the 3D grid (lines 70–170), and a plotting subroutine (lines 190–460). A final line (9998) provides a CLEAR and SAVE with auto-run.
- Lines 10–60: Set screen colors, projection constants (
CX,CY,RHO,D,THETA,PHI), and define eight componentDEF FNfunctions plus a compositeFN Z. - Lines 60–70: Allocate hidden-line arrays
N(255)andQ(255), then initializeN(a scalar, not the array) to 175 — note a bug described below. - Lines 80–170: Nested loops over
X(22 down to −55) andY(−40 to 19), callingFN Z(X)andGO SUB 190for each grid point. - Lines 190–460: The plotting subroutine: projects 3D→2D, interpolates along scan lines, and applies hidden-line logic using
N(R)andQ(R).
Surface Function Design
The composite surface FN Z(X) at line 52 sums eight component functions. Component FN G(X) (line 46) produces a radially symmetric cosine ripple: COS(0.06*(X²+Y²)). The remaining seven components are 2D Gaussian “bumps” (positive or negative) of varying amplitude, width, and center position, creating a landscape with hills and depressions superimposed on the ripple pattern.
Notably, all DEF FN functions take a formal parameter X but also reference the global variable Y directly (not passed as a parameter). This is standard Sinclair BASIC practice since only one parameter is supported per DEF FN; the global Y loop variable is used implicitly.
3D Perspective Projection
Lines 190–230 implement a standard rotation + perspective pipeline. The world point (X, Y, Z) is rotated by azimuth THETA and elevation PHI into eye coordinates (XE, YE, ZE), then divided by ZE and scaled by focal length D=750, offset to screen center (CX, CY).
| Variable | Role | Value |
|---|---|---|
THETA | Azimuth rotation angle (radians) | 0.4 |
PHI | Elevation angle (radians) | 1.25 |
RHO | Viewer distance offset added to ZE | 80 |
D | Focal length / perspective scale | 750 |
CX, CY | Screen center offset | 127, 87 |
Hidden-Line Removal Algorithm
The algorithm maintains two arrays of length 255: N(R) stores the lowest (minimum) screen Y plotted so far at screen column R, and Q(R) stores the highest (maximum). As the outer loop sweeps X from positive to negative (front-to-back in screen space), each new scan segment is interpolated pixel by pixel. A pixel is visible and plotted only if its YP extends beyond the current envelope stored in N(R) or Q(R); otherwise it is hidden behind an already-drawn surface.
The flag FG (in-bounds flag) suppresses plotting when R is outside 1–255 or YP is outside 1–175, while F tracks whether the current segment has started plotting (a stroke-continuation flag to avoid isolated dots).
Notable Techniques and Idioms
- Scan-line interpolation: Lines 250–290 compute slope
SL=(OY-SY)/DXand stepYPbySLfor each integer columnRbetween the previous and current projected X positions — a classic line rasterizer in BASIC. - Guard against division by zero: Line 250 sets
DX=1ifOX=SX, preventing a divide-by-zero in the slope calculation. - OX/OY state persistence:
OXandOY(old screen X and Y) are saved at line 360 acrossGOSUBreturns, enabling inter-call interpolation. - X loop direction: The outer
Xloop runs from 22 down to −55 (line 90), ensuring nearer surface rows are drawn first, which is essential for correct hidden-line behavior.
Bugs and Anomalies
Line 70 initialization bug: The line reads FOR I=1 TO 255: LET N=175: NEXT I. This assigns 175 to the scalar variable N, not to any element of the array N(). The intent was almost certainly LET N(I)=175 — initializing the lower envelope to the bottom of the screen (175 pixels). As written, N(R) elements begin at zero (default), meaning the hidden-line lower bound starts at 0 rather than 175. The upper array Q() is never explicitly initialized either, also defaulting to zero. The algorithm may still produce a reasonable image because the update logic at lines 370 and 420 grows both envelopes outward, but the initial state is incorrect.
Duplicate PLOT at line 450: Lines 440–450 are structurally identical to lines 390–400 (check F=0, then unconditionally plot), which is redundant but harmless — the point is plotted once regardless.
Line 150 dead comment: REM HCOLOR=2 is a vestige of the original Apple II source (HCOLOR sets hi-res color on the Apple), left in as a conversion artifact with no effect.
Content
Image Gallery
Source Code
    1 REM COMPLEX7                    PROGRAM A6.2                   (COSINE                         + EXPONENTIALS                  SURFACE)
    2 REM converted                       and embellished                 from the                        apple program                   by                              James N Jones                   2242 Locust                     Amarillo Texas 79109
    8 REM DRAWS UPPER RIGHT IMAGE ON FRONT COVER ON THE BOOK BY                                   Myers - MICROCOMPUTER GRAPHICS
    9 REM takes several                   hours to draw
   10 PAPER 1: INK 7: BORDER 3: CLS : CLS : LET CX=127: LET CY=87
   15 REM play around with these          RHO THETA D PHI
   20 LET RHO=80: LET D=750
   30 LET THETA=.4: LET S1=SIN (THETA): LET C1=COS (THETA)
   40 LET PHI=1.25: LET S2=SIN (PHI): LET C2=COS (PHI)
   42 REM the following                   functions                       can be omitted                  and played                      with
   43 DEF FN J(X)=-1*EXP (-.2*(ABS (X+1)^2)-.2*ABS (Y+1)^2)
   44 DEF FN I(X)=-6*EXP (-.1*(ABS (X)^2)-.3*(ABS (Y)^2))
   45 DEF FN H(X)=6*EXP (-.1*(ABS (X+10)^2)-.3*(ABS (Y-6)^2))
   46 DEF FN G(X)=COS (.06*(X*X+Y*Y))
   47 DEF FN W(X)=3*EXP (-.1*(ABS (Y+10)^2)-.02*(ABS (X+10)^2))
   48 DEF FN T(X)=4*EXP (-.1*(ABS (X+10)^2)-.3*(ABS (Y-6)^2))
   49 DEF FN S(X)=3*EXP (-.1*(ABS (Y+8)^2)-.02*(ABS (X-10)^2))
   50 DEF FN U(X)=-6*EXP (-.09*(ABS (X-5)^2)-.09*(ABS (Y-7)^2))
   52 DEF FN Z(X)=FN U(X)+FN T(X)+FN W(X)+FN S(X)+FN H(X)+FN G(X)+FN I(X)+FN J(X)
   60 DIM N(255): DIM Q(255)
   70 FOR I=1 TO 255: LET N=175: NEXT I
   80 REM POINT GENERATING LOOP
   90 FOR X=22 TO -55 STEP -1
  100 LET FL=0
  110 FOR Y=-40 TO 19
  120 LET Z=FN Z(X)
  130 GO SUB 190
  140 NEXT Y: NEXT X
  150 REM HCOLOR=2
  160 BEEP 1,1
  170 STOP
  180 REM PLOTTING SUBROUTINE
  190 LET XE=-X*S1+Y*C1
  200 LET YE=-X*C1*C2-Y*S1*C2+Z*S2
  210 LET ZE=-X*S2*C1-Y*S2*S1-Z*C2+RHO
  220 LET SX=D*(XE/ZE)+CX
  230 LET SY=D*(YE/ZE)+CY
  240 IF FL=0 THEN LET FL=1: LET F=0: GO TO 360
  250 LET DX=OX-SX: IF DX=0 THEN LET DX=1
  260 LET SL=(OY-SY)/DX: LET YP=OY
  270 FOR R=INT (OX)+1 TO SX
  280 LET FG=1
  290 LET YP=YP+SL
  300 IF R<1 OR R>255 THEN LET FG=0: LET F=0: GO TO 350
  310 IF YP>175 OR YP<1 THEN LET FG=0: LET F=0
  320 IF YP<=N(R) THEN GO TO 370
  330 IF YP>=Q(R) THEN GO TO 420
  340 LET F=0
  350 NEXT R
  360 LET OX=SX: LET OY=SY: RETURN
  370 LET N(R)=YP
  380 IF FG=0 THEN GO TO 410
  390 IF F=0 THEN PLOT R,YP: LET F=1
  400 PLOT R,YP
  410 IF YP<Q(R) THEN GO TO 350
  420 LET Q(R)=YP
  430 IF FG=0 THEN GO TO 460
  440 IF F=0 THEN PLOT R,YP: LET F=1
  450 PLOT  R,YP
  460 GO TO 350
 9998 CLEAR : SAVE "COMPLEX7" LINE 1
Note: Type-in program listings on this website use ZMAKEBAS notation for graphics characters.