
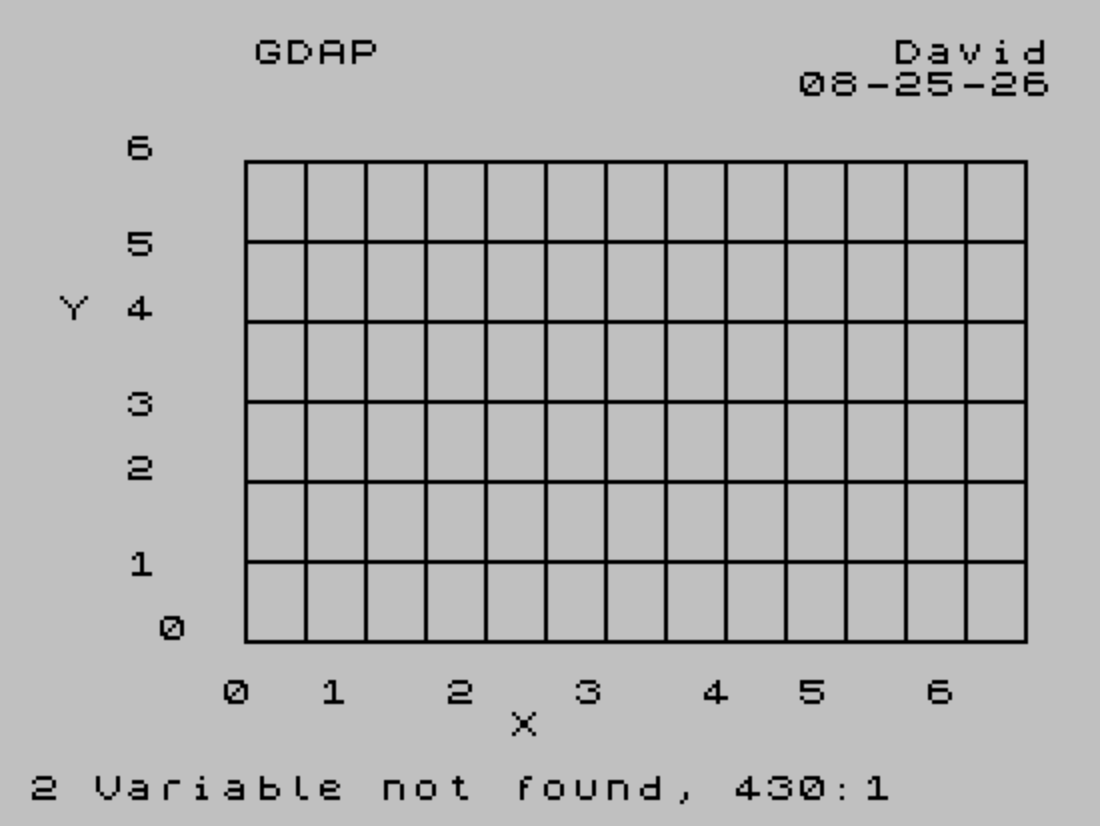
GDAP (Graphic Display and Print) plots a user-defined mathematical function on a labeled graph drawn with PLOT and DRAW commands. The program builds a complete chart frame with six evenly spaced tick marks on both axes, scaling values to multiples of six for clean division, and prints axis labels, a two-line title, author name, and date around the border. The function to be graphed must be entered directly into line 420 as a DEF FN Y(X) expression before the program is run, with the X domain mapped from pixel column 54–234 to 0–XFS and Y scaled into the 120-pixel-tall plot area. After displaying the graph, the user is prompted for a hard-copy printout via COPY, with eight blank LPRINT lines added as a footer.
Program Structure
The program is organized into four broad phases:
- Input collection (lines 20–90): Gathers graph title, subtitle, author name, date, full-scale axis values, and axis labels.
- Frame drawing (lines 100–390): Clears the screen, draws the axis border with
PLOT/DRAW, prints all text annotations, and overlays a grid of horizontal and vertical lines. - Function plotting (lines 400–450): Iterates over pixel columns 54–234, evaluates the user-supplied function via
DEF FN Y(X)at line 420, scales the result, and plots each point. - Output (lines 460–510): Prompts for a printer hard copy, executes
COPYif requested, appends eight blank lines viaLPRINT, then stops.
Axis Scaling and Grid Layout
Both axes are divided into six equal intervals, which is why the program instructs the user to choose full-scale values that are multiples of six. Tick-mark labels are computed by dividing XFS and YFS by 6, 3, 2, 2/3, 5/6, and 1, then rounding to two decimal places using the idiom INT (value * 100) / 100.
The horizontal plot area spans pixel columns 54–234 (180 pixels), and the vertical area spans rows 24–144 (120 pixels). The horizontal grid lines are drawn every 20 pixels (lines 350–360) and vertical grid lines every 15 pixels (lines 370–380), producing a six-by-six grid.
User-Defined Function Mechanism
The most distinctive design choice is that line 420 contains a placeholder DEF FN Y(X)=FUNCTION which the user must edit before running the program. This is documented in the REM at line 390. Because DEF FN is defined inside the plotting loop (lines 400–450), it is re-evaluated on every iteration — a legal but unnecessary use of DEF FN; defining it once before the loop would be equivalent and slightly faster.
The X variable is derived from the pixel column P via:
X = (XFS / 180) * (P - 54)
This linearly maps pixel 54 → X=0 and pixel 234 → X=XFS. The Y pixel position is then:
Q = ((120 / YFS) * Y) + 24
mapping Y=0 to the baseline (row 24) and Y=YFS to the top (row 144).
Notable Techniques and Idioms
- PI as a column index: Lines 290–340 use
PI(≈3.14159) as the column argument toPRINT AT. BASIC truncates this to integer 3, so all Y-axis labels are printed in column 3. This is a space-saving trick, reusing the built-in constant rather than typing the digit3. - Two-decimal rounding: The pattern
INT (value * 100) / 100appears six times for each axis to format tick labels cleanly. - Input validation: Line 470 implements a simple validation loop for the printout prompt, rejecting any input that is neither “Y” nor “N”.
- COPY and LPRINT footer: Lines 480–510 show that after
COPYdumps the screen to the printer, eight blankLPRINTlines feed the paper to a readable position before stopping. - SAVE with LINE: Line 520 saves the program with an auto-run directive pointing to line 5 (which does not exist in the listing as shown, so execution would fall through to line 20, the first actual line).
Bugs and Anomalies
- No Y clipping: If
FN Y(X)returns a value outside 0–YFS, the computedQwill fall outside the 24–144 pixel range.PLOTwill attempt to plot outside the grid without error checking, potentially drawing points outside the chart area or triggering an error. - DEF FN inside loop: Placing
DEF FN Y(X)=...at line 420 inside theFOR Ploop means the function is redefined on each of the 181 iterations. This works correctly but wastes time; it could be moved before line 400 with no change in behavior. - Mixed case loop variables: The loop at line 350 uses
IbutNEXT i(lowercase), and line 370 usesJwithNEXT j. In standard BASIC these are the same variable, so it is not an error, but the inconsistency may confuse readers. - Title spacing instruction: The prompts at lines 20–30 instruct the user to use exactly 17 spaces total. There is no enforcement of this constraint; longer or shorter strings will simply misalign the printed header.
Variable Summary
| Variable | Purpose |
|---|---|
T$ | Primary graph title |
O$ | Secondary title / subtitle |
N$ | Author name |
D$ | Date string |
XFS | X-axis full-scale value |
YFS | Y-axis full-scale value |
X$ | X-axis label |
Y$ | Y-axis label |
L | Loop index for printing Y$ vertically |
I | Loop index for horizontal grid lines |
J | Loop index for vertical grid lines |
P | Pixel column index in plotting loop |
X | Scaled X value passed to FN Y |
Y | Result of FN Y(X) |
Q | Scaled pixel row for plotting Y |
Z$ | Printout yes/no response |
K | Loop index for blank LPRINT lines |
Image Gallery
Source Code
  10 REM Graphic Display & Print "GDAP"Enter function at line 420PROGRAM BY DICK PTAK  CLEVELAND SINCLAIR USERS GROUP
  20 CLS :INPUT "TITLE OF GRAPH (17 SPACES TOTAL) ";T$
  30 INPUT "OTHER TITLE INFORMATION (17 SPACES TOTAL) ";O$
  40 INPUT "ENTER YOUR NAME";N$
  50 INPUT "DATE XX-XX-XX ";D$
  60 INPUT "X-AXIS FULL SCALE VALUE, USE MULTIPLES OF 6 ";XFS
  70 INPUT "X-AXIS LABEL ";X$
  80 INPUT "Y-AXIS FULL SCALE VALUE, USE MULTIPLES OF 6 ";YFS
  90 INPUT "Y-AXIS LABEL ";Y$
 100 CLS
 110 PLOT 249,24
 120 DRAW -195,0
 130 DRAW 0,120
 140 PRINT AT 0,7;T$
 150 PRINT AT 1,7;O$
 160 PRINT AT 0,(32- LEN N$);N$
 170 PRINT AT 1,24;D$
 180 PRINT AT 21,15;X$
 190 FOR L=1 TO LEN Y$
 200 PRINT AT (L+7),1;Y$(L)
 210 NEXT L
 220 PRINT AT 20,6;"0  "; INT ((XFS/6)*100)/100
 230 PRINT AT 20,13; INT ((XFS/3)*100)/100
 240 PRINT AT 20,17; INT ((XFS/2)*100)/100
 250 PRINT AT 20,21; INT ((2*XFS/3)*100)/100
 260 PRINT AT 20,24; INT ((5*XFS/6)*100)/100
 270 PRINT AT 20,28; INT (XFS*100)/100
 280 PRINT AT 18,4;"0"
 290 PRINT AT 16, PI; INT ((YFS/6)*100)/100
 300 PRINT AT 13, PI; INT ((YFS/3)*100)/100
 310 PRINT AT 11, PI; INT ((YFS/2)*100)/100
 320 PRINT AT 8, PI; INT ((2*YFS/3)*100)/100
 330 PRINT AT 6, PI; INT ((5*YFS/6)*100)/100
 340 PRINT AT PI, PI; INT (YFS*100)/100
 350 FOR I=44 TO 144 STEP 20
 360 PLOT 54,I:DRAW 195,0:NEXT i
 370 FOR J=69 TO 249 STEP 15
 380 PLOT J,24:DRAW 0,120:NEXT j
 390 REM INSERT AT BEGINNING(DEF FN(VARM,,,)=EXPRESSION
 400 FOR P=54 TO 234
 410 LET X=(XFS/180)*(P-54)
 420 DEF FN Y(X)=FUNCTION
 430 LET Y= FN Y(X)
 440 LET Q=((120/YFS)*Y)+24
 450 PLOT P,Q:NEXT p
 460 INPUT "DO YOU WANT A PRINTOUT? ";Z$
 470 IF Z$ <>"Y" AND Z$ <>"N" THEN GO TO 460
 480 IF Z$="Y" THEN COPY
 490 IF Z$="N" THEN STOP
 500 FOR K=1 TO 8:LPRINT :NEXT K
 510 STOP
 520 SAVE "GDAP" LINE 5
Note: Type-in program listings on this website use ZMAKEBAS notation for graphics characters.