
This program computes linear regression for two paired variable sets, producing the line equation Y = C + MX along with the coefficient of determination (R²). After data entry, the user can correct individual pairs before calculation begins. The computed results are displayed both numerically and graphically: a scatter plot of the data points is drawn using four-pixel clusters, and the regression line is overlaid on the same axes. The program uses a scaling factor derived from the maximum X and Y values to fit all data within the 256×176 pixel screen area, and it guards against division-by-zero conditions by tracking the largest observed values.
Program Structure
The program is divided into clearly separated phases:
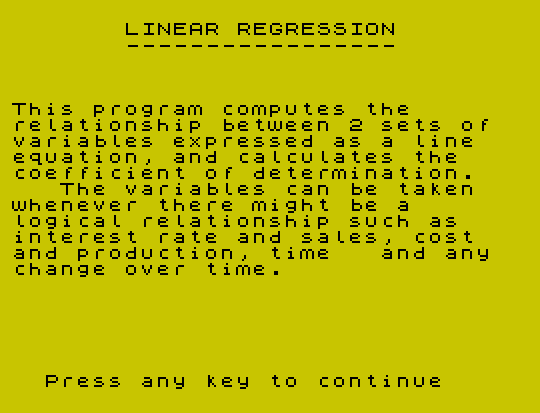
- Introduction (lines 20–90): Two screens of explanatory text about linear regression and R², separated by a keypress subroutine at line 630.
- Data entry (lines 100–180): Collects
npairs of X/Y values into a 2D arrayb(n,2). - Correction loop (lines 190–260): Allows the user to overwrite any pair by number; loops back to the correction prompt until the user declines.
- Calculation (lines 270–360): Accumulates sums and computes slope
m, interceptc, and R². - Output and graphing (lines 370–610): Prints the equation and R², draws axes with tick marks, plots data points as 2×2 pixel squares, and overlays the regression line.
Statistical Calculations
The standard least-squares formulas are used. Slope and intercept are computed at lines 350–360:
m = (n*xy - sx*sy) / (n*xx - sx²)c = (xx*sy - sx*xy) / (n*xx - sx²)
The coefficient of determination R² is computed at line 390 as the square of the Pearson correlation coefficient, using ABS to avoid negative results from floating-point artifacts. The formula applies SQR to the product of the two variance terms and then squares the whole expression, which is algebraically equivalent to the standard R² formula but structured unusually — the squaring is applied outside the SQR, effectively cancelling it for the denominator product while keeping the numerator squared.
Graphing Technique
Axes are drawn at lines 420–460 with tick marks every 15 pixels on both axes. Scale labels showing the maximum axis values are printed at line 490. Notably, AT PI,1 is used, where PI (≈3.14159) is truncated to row 3, placing the Y-axis maximum label near the top of the graph area — an unconventional but functional use of the automatic integer truncation applied to PRINT AT row and column arguments.
Each data point is plotted as a 2×2 block of pixels (lines 510–540), giving better visibility than a single pixel. The regression line is drawn by iterating x from 0 to 240 in steps of 2 (line 560), with bounds-checking at lines 570–600 to skip points that fall outside the drawable area or below zero.
Scaling
Lines 470–480 compute separate X and Y scale factors based on the maximum observed values (bigx and bigy), then select the smaller of the two to ensure the entire dataset fits within the 240×150 pixel graph area without distortion. This uniform scaling preserves the visual slope of the regression line relative to the data.
Notable Techniques and Idioms
LET sx=0:LET sy=sx:LET xx=sx:LET yy=sx:LET xy=sx(line 110) — efficient chained zero-initialization, assigning from the just-set variable rather than the literal0each time.PAUSE NOT PIat line 630 — sincePIis non-zero,NOT PIevaluates to 0, makingPAUSE 0which waits indefinitely for a keypress. This is a compact keypress-wait idiom.- Line 270 uses escape codes
\{18}\{1}and\{18}\{0}(BRIGHT 1 and BRIGHT 0 control codes embedded in a string) to highlight the “computing” status message. - Line 340 contains a
REMwith similar embedded control codes, serving as a developer annotation for the equation form that never affects execution.
Bugs and Anomalies
| Location | Issue |
|---|---|
| Lines 320, 350, 360, 390 | ABS x^2 and ABS sx^2 are used instead of x^2 and sx^2. Due to operator precedence, ABS x^2 is parsed as ABS(x)^2, so ABS has no effect for squared values (squaring always yields a non-negative result). This is harmless but unnecessary. |
| Line 390 | The R² formula applies SQR to the product of two variance terms before squaring; this is unconventional structuring. If either variance term is negative (impossible for valid data but theoretically risky), SQR would error. The outer ABS guards against sign issues in the numerator but not the denominator. |
| Lines 300–310 | bigx and bigy only track the maximum value seen; negative data or data where the maximum is 0 would cause a divide-by-zero at line 470 or produce an inverted/collapsed graph. |
| Line 240 | The correction display uses AT i-1,0, which works correctly only if i equals the pair’s original display row. Since the data was printed sequentially from row 0, this aligns with pair number minus one, but only if fewer than ~21 pairs were entered (screen scroll would misalign rows for larger datasets). |
Image Gallery
Source Code
  10 REM  A STATISTICS UTILITY           PROGRAM BY D.J. CURRIE
  20 BORDER 6:PAPER 6:CLS :INK 0
  30  PRINT AT 1,7;"LINEAR REGRESSION"
  40 PRINT TAB 7;"-----------------"
  50 PRINT '''"This program computes the","relationship between 2 sets of  variables expressed as a line   equation, and calculates the    coefficient of determination."'"   The variables can be taken   whenever there might be a","logical relationship such as","interest rate and sales, cost   and production, time   and any  change over time."
  60 GO SUB 630
  70 PRINT '"   The coefficient of","determination R^2 (r squared)   is a measure of how much the","variability of Y is related to  the variability of X. "'"   R^2 varies between 0 and 1 somultiplied by 100 gives a","percent indication of the","accuracy of expressing Y as a   function of X."
  80 PRINT '"   Linear regression can be","used to approximate the value   of one variable given the","other, identify the trend with  time and forecast future values or evaluate the influence of","one variable on the other."
  90 GO SUB 630
 100 INPUT "How many pairs of items?  ";n
 110 LET sx=0:LET sy=sx:LET xx=sx:LET yy=sx:LET xy=sx
 120 DIM b(n,2)
 130 FOR a=1 TO n
 140 INPUT "Enter: X=";x;"  Y=";y
 150 PRINT "Pair ";a;":"; TAB 13; "X=";x; TAB 21;"Y=";y
 160 LET b(a,1)=x
 170 LET b(a,2)=y
 180 NEXT a
 190 INPUT "Any corrections (y/n) ?  ";a$
 200 IF a$ <>"y" AND a$ <>"Y" THEN GO TO 270
 210 INPUT "Which pair number?  ";i
 220 IF i>n THEN GO TO 210
 230 INPUT "Enter: X=";x;"  Y=";y
 240 PRINT AT i-1,0;"Pair ";i;":"; TAB 13; "X=";x;"  "; TAB 21;"Y=";y;"  "
 250 LET a=i:LET b(a,1)=x:LET b(a,2)=y
 260 GO TO 190
 270 PRINT AT 21,1;"\{18}\{1} I'm computing... Please wait \{18}\{0}"
 280 LET sx=0:LET sy=sx:LET xx=sx:LET yy=sx:LET xy=sx:LET bigx=sx:LET bigy=sx
 290 FOR a=1 TO n
 300 LET x=b(a,1):IF x>bigx THEN LET bigx=x
 310 LET y=b(a,2):IF y>bigy THEN LET bigy=y
 320 LET sx=sx+x:LET sy=sy+y:LET xx=xx+ ABS x^2:LET yy=yy+ ABS y^2:LET xy=xy+x*y
 330 NEXT a
 340 REM \{20}\{1} Y = C + MX \{20}\{0}
 350 LET m=(n*xy-sx*sy)/(n*xx- ABS sx^2)
 360 LET c=(xx*sy-sx*xy)/(n*xx- ABS sx^2)
 370 PAUSE 30:CLS
 380 PRINT "Y = ";c;" + ";m;" * X"
 390 LET rr= ABS ((n*xy-sx*sy)/ SQR (((n*xx- ABS sx^2)^.5*(n*yy- ABS sy^2)^.5))^2)
 400 PRINT AT 1,16;"R^2 = ";rr
 410 PRINT AT 2,22;"R^2 = "; INT (rr*100+.5);"%"
 420 PLOT 0,151:DRAW 0,-151:DRAW 241,0
 430 FOR s=151 TO 1 STEP -15:PLOT 1,s:NEXT s
 440 FOR s=1 TO 241 STEP 15:PLOT s,1:NEXT s
 450 PLOT 2,151:PLOT 241,2
 460 PLOT 3,151:PLOT 241,3
 470 LET facx=240/bigx:LET facy=150/bigy
 480 LET fac=facx:IF facy<fac THEN LET fac=facy
 490 PRINT AT PI,1; INT (150/fac); AT 20,28; INT (240/fac)
 500 FOR a=1 TO n
 510 PLOT INT (b(a,1)*fac+.5), INT (b(a,2)*fac+.5)
 520 PLOT INT (b(a,1)*fac+.5)+1, INT (b(a,2)*fac+.5)
 530 PLOT INT (b(a,1)*fac+.5)+1, INT (b(a,2)*fac+.5)+1
 540 PLOT INT (b(a,1)*fac+.5), INT (b(a,2)*fac+.5)+1
 550 NEXT a
 560 FOR x=0 TO 240 STEP 2
 570 IF (m*x+c)<0 THEN GO TO 600
 580 IF x*fac>240 THEN GO TO 620
 590 PLOT x*fac,(m*x+c)*fac
 600 IF fac*(m*x+c)>150 THEN GO TO 620
 610 NEXT x
 620 STOP
 630 PRINT #1;"  Press any key to continue":PAUSE NOT PI:CLS :RETURN
 640 SAVE "LIN REGR" LINE 20
Note: Type-in program listings on this website use ZMAKEBAS notation for graphics characters.