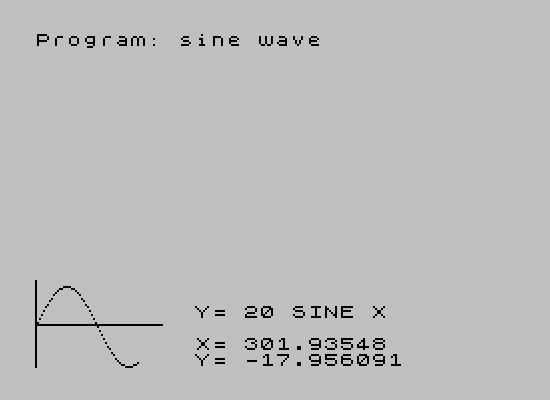
This program draws a sine wave on screen using PLOT commands, cycling through 63 x-positions (0 to 62) and computing y values with the formula 20+20*SIN(x/31*PI), which maps one full period of the sine function across the display width. The program first draws reference axes using PLOT and DRAW before entering the plotting loop. At each step, the current x value (scaled to degrees 0–360) and the computed y value (offset removed) are displayed in the lower portion of the screen using PRINT AT. The loop pauses at each point until the ENTER key is released, providing a step-through animation effect via the INKEY$ check at line 100.
Program Analysis
Program Structure
The program is short and linear, consisting of an initialization phase (lines 20–30), a display label (line 50), and a single FOR loop (lines 40–110) that plots the sine wave one point at a time. There is no subroutine structure; all logic is inline within the loop.
- Lines 20–30: Draw the x-axis (horizontal line at y=21, length 63) and y-axis (vertical line at x=0, height 43).
- Lines 40–110: Main loop over
x= 0 to 62, computing and plotting each sine value. - Lines 50–80: Inside the loop, three
PRINT ATstatements display the equation label, the current x in degrees, and the current y value. - Line 90:
PLOT x,yplaces the pixel on screen. - Line 100: Busy-waits while ENTER is held down, then continues on release.
Mathematics and Coordinate Mapping
The sine formula at line 70 is y = 20 + 20*SIN(x/31*PI). Dividing x (range 0–62) by 31 gives a range of 0 to 2, and multiplying by PI yields 0 to 2π — exactly one full sine period. The vertical offset of 20 shifts the wave center upward in screen coordinates, while the amplitude of 20 pixels keeps the wave within bounds. The display readout at line 80 subtracts the 20 offset to show the true mathematical y value to the user.
The x-axis degree display at line 60 scales x*360/62, correctly mapping the loop range to 0°–360° for human-readable output.
Key BASIC Idioms and Techniques
- Step-through animation: Line 100 uses
IF INKEY$=CHR$ 13 THEN GO TO 100to hold execution while ENTER is pressed. This is the inverse of the usual “wait for keypress” pattern — it waits for the key to be released (or not pressed), so the loop only advances when ENTER is not held. In practice, if the user never presses ENTER, the loop runs continuously without pause. PRINT AToverdraw: The label, x, and y values are reprinted at fixed screen positions each iteration, effectively updating in place without clearing the screen.- Axis drawing: Using
PLOT/DRAWfor the axes before entering the loop is clean and efficient, ensuring the reference lines are drawn once.
Potential Anomalies
The axis at line 20 draws a horizontal line at y=21 from x=0 for 63 pixels, and the vertical axis at line 30 rises from y=0 for 43 pixels. The sine wave is plotted with y values in the range 0–40 (since the offset is 20 and amplitude is 20), so the wave fits within the vertical axis length. However, the horizontal axis at y=21 bisects the wave’s center (y=20) only approximately — the axis sits one pixel above center. This is a minor cosmetic offset rather than a functional bug.
The PRINT AT 18,10 label at line 50 is inside the loop and reprints the same string every iteration, which is redundant but harmless. Moving it before the loop would be a minor optimization.
Variable Summary
| Variable | Purpose |
|---|---|
x | Loop counter, also the screen x-coordinate (0–62) |
y | Computed screen y-coordinate, range approximately 0–40 |
Content
Image Gallery
Source Code
   10 REM >>  Sine Wave  <<                                      by Ted Pozyski                                 \* Sync,  M/A 1984
   20 PLOT 0,21: DRAW 63,0
   30 PLOT 0,0: DRAW 0,43
   40 FOR x=0 TO 62
   50 PRINT AT 18,10;"Y= 20 SINE X"
   60 PRINT AT 20,10;"X= ";x*360/62
   70 LET y=20+20*SIN (x/31*PI)
   80 PRINT AT 21,10;"Y= ";y-20
   90 PLOT x,y
  100 IF INKEY$=CHR$ 13 THEN GO TO 100
  110 NEXT x
Note: Type-in program listings on this website use ZMAKEBAS notation for graphics characters.