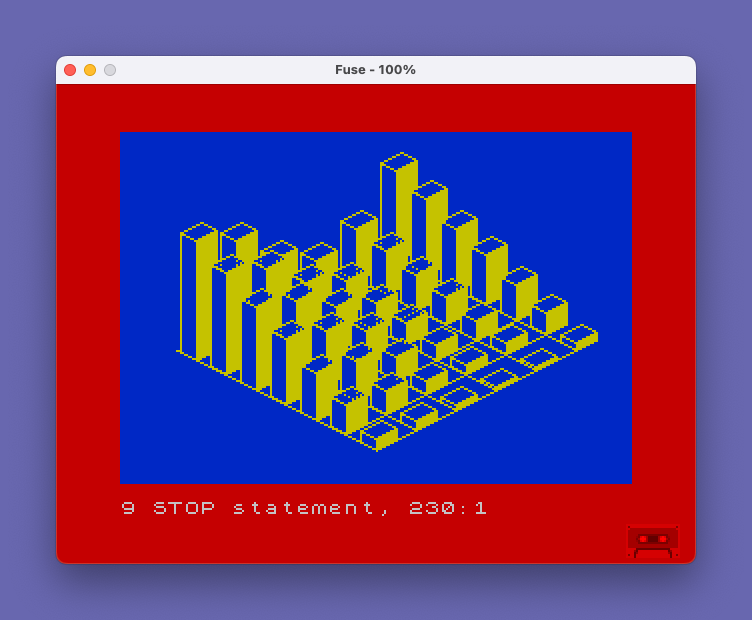
This program renders a three-dimensional bar chart with solid bars arranged along two horizontal axes, using the mathematical function z=(4+2*COS(x/20))*(y/10+1) to determine bar heights. The chart is drawn using an isometric-style projection with two direction vectors: dx1/dy1 (10,5) for the x-axis direction and dx2/dy2 (8,4) for the y-axis direction. Bars are constructed by drawing their front face, side face, and top parallelogram as separate geometric elements, using INVERSE 1 mode to erase overlapping portions before redrawing clean edges. The grid is laid out first via a subroutine at line 400, then bars are drawn back-to-front (x and y decremented) to achieve a natural painter’s-algorithm hidden-surface effect. The program uses INK 6, PAPER 1, and BORDER 2 for a yellow-on-blue color scheme.
Program Analysis
Program Structure
The program is organized into three distinct sections: initialization and main loop (lines 100–230), a grid-drawing subroutine (lines 400–480), and a bar-drawing subroutine (lines 500–780). Line 999 references a MOVE command, indicating a TS2068-specific save operation alongside the standard SAVE at line 998.
| Lines | Role |
|---|---|
| 100–115 | Comments and display setup (INK, PAPER, BORDER, CLS) |
| 120–150 | Projection constants: origin (cx, cy), axis direction vectors |
| 160–230 | Main logic: draw grid, then iterate bars back-to-front |
| 400–480 | Grid subroutine: draws isometric x and y axis lines |
| 500–780 | Bar subroutine: draws front face, side face, and top face |
Mathematical Function and Projection
The bar height is computed as z=INT((4+2*COS(x/20))*(y/10+1)). Here x ranges 0–100 in steps of 20 and y ranges 0–90 in steps of 15, producing a 6×7 grid of bars with heights modulated by a cosine wave along the x-axis and linearly scaled by y.
The isometric projection uses two axis vectors stored in constants: dx1=10, dy1=5 for the x-axis and dx2=8, dy2=4 (with negated x) for the y-axis. The screen origin is at cx=128, cy=16. A point at grid coordinates (x, y, z) maps to screen position (cx+x-y, cy+x/2+y/2+z).
Painter’s Algorithm for Hidden Surfaces
The main loop iterates x from 100 down to 0 and y from 90 down to 0. This back-to-front ordering ensures that bars closer to the viewer (smaller x, smaller y) are drawn last and naturally overwrite bars behind them, implementing a painter’s algorithm without any depth buffer.
Bar Drawing Technique
Each bar is rendered in four stages within the subroutine at line 500:
- Front face (lines 510–540): Draws
zparallel lines along the x-axis direction usingDRAW dx1,dy1, stacked vertically. - Side face erasure (lines 550–600): Uses
INVERSE 1to erase pixels that would overlap the y-axis side, preventing artifacts on the front-face strokes. - Side face outline (lines 610–650): Draws the left-side parallelogram as a closed four-segment outline with explicit
DRAWcommands. - Top face (lines 660–780): Erases the top area with
INVERSE 1before drawing the top parallelogram as a clean four-segment outline.
Use of INVERSE Mode
INVERSE 1 (lines 550 and 660) is used as an erase operation before drawing clean geometry. Because the Spectrum’s DRAW XORs pixels in INVERSE mode, running the same strokes inverted removes previously drawn pixels, allowing the program to overdraw regions without leaving stray marks from earlier rendering passes.
Notable Anomalies
- Line 690 computes the top-erasure plot position as
cy+z+(x+y+n)/2rather than the expectedcy+x/2+y/2+z. The term(x+y+n)/2is mathematically equivalent tox/2+y/2+n/2, introducing a smalln/2drift per iteration. This is likely an approximation or minor bug in the erasure sweep. - Line numbers jump from 480 to 500 and include a gap at 690 (skipping 680), suggesting the program was edited in place with some lines removed.
- The grid subroutine reuses variable
x(lines 400–430) andy(lines 440–470) as loop counters, which is harmless since the grid is drawn before the main chart loop begins.
Variable Summary
| Variable | Purpose |
|---|---|
cx, cy | Screen origin of the chart |
dx1, dy1 | X-axis direction vector (10, 5) |
dx2, dy2 | Y-axis direction vector magnitude (8, 4) |
x, y | Grid coordinates (also reused in grid subroutine) |
z | Computed bar height in pixels |
n | Loop counter within bar face drawing |
Content
Image Gallery
Source Code
  100 REM 3 axis chart with solid bars
  110 REM z=(4+2*COS (x/20))*(y/10+1)
  115 INK 6: PAPER 1: BORDER 2: CLS
  120 LET cx=128: LET cy=16
  130 LET dx1=10: LET dy1=5
  140 LET dx2=8: LET dy2=4
  150 REM Draw x,y grid
  160 GO SUB 400
  165 REM Draw chart
  170 FOR x=100 TO 0 STEP -20
  180 FOR y=90 TO 0 STEP -15
  190 LET z=INT ((4+2*COS (x/20))*(y/10+1))
  195 REM Draw bar
  200 GO SUB 500
  210 NEXT y
  220 NEXT x
  230 STOP
  390 REM x,y grid subroutine
  400 FOR x=0 TO 100 STEP 20
  410 PLOT cx+x,cy+x/2
  420 DRAW -100,50
  430 NEXT x
  440 FOR y=0 TO 90 STEP 15
  450 PLOT cx-y,cy+y/2
  460 DRAW 110,55
  470 NEXT y
  480 RETURN
  500 REM Bar drawing subroutine
  505 REM Draw face of bar
  510 FOR n=0 TO z-1
  520 PLOT cx+x-y,cy+x/2+y/2+n
  530 DRAW dx1,dy1
  540 NEXT n
  545 REM Erase side of bar
  550 INVERSE 1
  560 FOR n=0 TO z-1
  570 PLOT cx+x-y,cy+x/2+y/2+n
  580 DRAW -dx2,dy2
  590 NEXT n
  600 INVERSE 0
  605 REM Draw side of bar
  610 PLOT cx+x-y,cy+x/2+y/2
  620 DRAW -dx2,dy2
  630 DRAW 0,z
  640 DRAW dx2,-dy2
  650 DRAW 0,-z
  655 REM Erase top of bar
  660 INVERSE 1
  670 FOR n=0 TO dx2-1
  690 PLOT cx+x-y-n,cy+z+(x+y+n)/2
  700 DRAW dx1,dy1
  710 NEXT n
  720 INVERSE 0
  725 REM Draw top of bar
  730 PLOT cx+x-y,cy+x/2+y/2+z
  740 DRAW dx1,dy1
  750 DRAW -dx2,dy2
  760 DRAW -dx1,-dy1
  770 DRAW dx2,-dy2
  780 RETURN
  998 SAVE "3AXIS" LINE 1: STOP
  999 OUT 244,1: MOVE "3DAXIS.BAS",1
Note: Type-in program listings on this website use ZMAKEBAS notation for graphics characters.