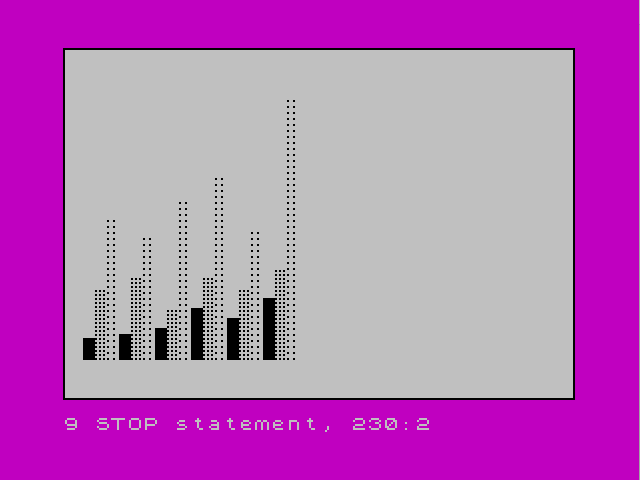
This program draws a dot-density bar chart on screen using PLOT and FOR/NEXT loops, reading bar data from DATA statements in pairs: bar height and dot spacing. Each bar is rendered as a grid of plotted pixels, with the dot density controlling the spacing between each plotted point in both the horizontal and vertical axes. A border is drawn first via a subroutine at line 400 using DRAW commands. The technique originates from Nick Hampshire’s Color Graphics book.
Program Structure
The program is divided into four logical sections:
- Lines 1–4: Introduction text and keypress wait before starting.
- Lines 60–90: Colour setup (INK, PAPER, BORDER) and subroutine call to draw the border.
- Lines 100–300: Main bar-chart drawing loop reading DATA pairs and plotting bars.
- Lines 400–460: Border-drawing subroutine using
PLOT/DRAW.
Data Format
Bar data is stored in lines 130–155 as pairs h,d where h is the bar height and d is the dot density (step size). A sentinel pair 0,0 at line 170 terminates the read loop. The six groups of three bars each (18 bars total) are laid out across the screen.
| Line | Bar 1 (h,d) | Bar 2 (h,d) | Bar 3 (h,d) |
|---|---|---|---|
| 130 | 20, 1 | 45, 2 | 80, 3 |
| 135 | 22, 1 | 50, 2 | 70, 3 |
| 140 | 25, 1 | 35, 2 | 90, 3 |
| 145 | 35, 1 | 50, 2 | 100, 3 |
| 150 | 30, 1 | 45, 2 | 75, 3 |
| 155 | 40, 1 | 55, 2 | 140, 3 |
Bar Drawing Technique
Each bar occupies a horizontal span of 6 pixels (b to b+5), and the variable b is incremented by 6 at line 290 after each bar is drawn. The dot density value d is used as the STEP in both the outer x loop (line 240) and the inner y loop (line 250), so a density of 1 produces a solid-looking bar, 2 a medium-density dotted fill, and 3 a sparse dotted fill. This elegantly encodes fill style directly into the plotting loops without requiring any additional conditional logic.
Border Subroutine
The subroutine at lines 400–460 draws a rectangular border around the full 256×176 pixel plotting area using a sequence of DRAW commands. Note that the screen plotting area is 255×175 pixels (0–255 wide, 0–175 tall), so the DRAW 255,0 and DRAW 0,175 calls reach the far edges correctly from the origin at PLOT 0,0.
Key BASIC Idioms
- Line 3 uses
IF INKEY$="" THEN GO TO 3as a simple keypress wait — a standard Sinclair idiom. - The sentinel
DATA 0,0at line 170 with the checkIF d=0 THEN STOPat line 230 is a clean loop termination pattern for DATA-driven programs. GO TO 220at line 300 re-enters the READ loop without a FOR/NEXT counter, relying on the DATA pointer advancing automatically.
Content
Image Gallery
Source Code
    1 PRINT "This barchart routine is one    that can be adapted to your own programs.  The data for the barsis stored in lines 130-155 in   pairs, the first being the bar  height and the second the dot   density.  From Nick Hampshire's ""Color Graphics""."
    2 PRINT : PRINT "Press any key for a demo."
    3 IF INKEY$="" THEN GO TO 3
    4 CLS
   60 INK 0
   70 PAPER 7: BORDER 3
   90 GO SUB 400
  100 REM data
  130 DATA 20,1,45,2,80,3
  135 DATA 22,1,50,2,70,3
  140 DATA 25,1,35,2,90,3
  145 DATA 35,1,50,2,100,3
  150 DATA 30,1,45,2,75,3
  155 DATA 40,1,55,2,140,3
  170 DATA 0,0
  200 REM draw barchart
  210 LET b=10
  220 READ h,d
  230 IF d=0 THEN STOP
  240 FOR x=b TO b+5 STEP d
  250 FOR y=20 TO h+10 STEP d
  260 PLOT x,y
  270 NEXT y
  280 NEXT x
  290 LET b=b+6: REM set start next bar
  300 GO TO 220
  400 REM border
  410 PLOT 0,0
  420 DRAW 255,0
  430 DRAW 0,175
  440 DRAW -255,0
  450 DRAW 0,-175
  460 RETURN
Note: Type-in program listings on this website use ZMAKEBAS notation for graphics characters.