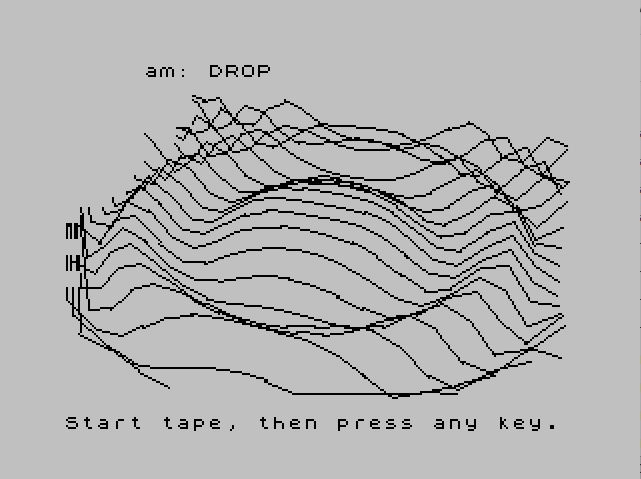
This program renders a 3D surface plot of the function z = cos(0.1·(x²+y²)) — a “ripple” or “drop” surface — using perspective projection onto the screen. It implements a full 3D-to-2D coordinate transform at lines 20–30, applying rotation angles theta and phi with precomputed sine/cosine values, plus a perspective divide by ze (the depth coordinate). The plot is drawn as a series of connected line segments using DRAW, scanning x from 10 to -10 and y from -10 to 10, with boundary clipping at line 110 to avoid off-screen coordinates. The program is a TS2068 conversion of an algorithm from the book “Microcomputer Graphics” by Roy E. Myers, credited to James N. Jones of Amarillo, Texas.
Program Analysis
Program Structure
The program is organized into a few distinct functional blocks:
- Lines 1–7: REMs, screen setup (BRIGHT, INK), and initial values for
sx1/sy1. - Line 10:
GO TO 40skips over the subroutine definitions at lines 20–30. - Lines 20–30: Subroutine — performs 3D rotation and perspective projection, returning screen coordinates
sx,sy. - Line 40: Initializes all projection parameters.
- Line 50: Defines the surface function
FN z(x)(also uses the outer variabley). - Lines 70–150: Double nested loop over x and y, computing and drawing the surface.
- Line 9998: Saves the program.
3D Projection Subroutine (Lines 20–30)
The subroutine at lines 20–30 implements a standard perspective projection pipeline. Line 20 computes eye-space coordinates using a rotation matrix parameterized by theta (azimuth) and phi (elevation), with precomputed values s1, s2, c1, c2. Line 30 applies the perspective divide — dividing by ze (depth) and scaling by d — to produce screen pixel coordinates sx and sy, offset by the screen center cx, cy.
| Variable | Meaning | Value |
|---|---|---|
rho | Distance from origin to eye | 30 |
d | Perspective scale factor | 350 |
theta | Azimuth angle (radians) | 0.3 |
phi | Elevation angle (radians) | 1 |
cx, cy | Screen center offsets | 127, 87 |
Surface Function
Line 50 defines DEF FN z(x)=COS(.1*(x*x+y*y)). Notably, the formal parameter is x, but the function also references the outer variable y from the enclosing loop — a common BASIC technique where DEF FN closes over the current value of non-parameter variables. This means the function is effectively a two-variable surface z = cos(0.1·(x²+y²)), producing the classic circular “water drop” ripple pattern.
Drawing Loop and Clipping
The outer loop (line 70) iterates x from 10 down to -10 in steps of -1; the inner loop (line 90) iterates y from -10 to 10. For each (x, y) pair, the surface value is computed and the subroutine called. Line 110 clips points that project outside the display area (0–255 horizontally, 0–175 vertically), resetting the fl flag to force a new PLOT rather than a DRAW on the next valid point. Line 120 issues a PLOT only when starting a new stroke (fl=0), and line 130 issues a DRAW relative to the previous screen point stored in sx1/sy1. This pen-up/pen-down idiom avoids drawing lines across clipped gaps.
Notable Techniques and Idioms
- Precomputed trig:
s1,s2,c1,c2are computed once at line 40 and reused in every iteration of the inner subroutine, avoiding repeated calls toSIN/COS. - Relative DRAW: Line 130 uses
DRAW (sx1-sx),(sy1-sy)rather than absolute coordinates, consistent with the Spectrum/TS2068DRAWsyntax which takes relative offsets. - INK color cycling:
INK 0is set at line 136 (inside the y loop) andINK 7is restored at line 145 (after each x row), suggesting an intent to draw successive rows in alternating ink — though sinceink=0is set at line 4 and never otherwise used, this coloring scheme has limited practical effect beyond the final state. - Flag variable
fl: The variableflacts as a pen-state flag. It is reset to 0 at the start of each y-row (line 80) and on clipping (line 110), but is never explicitly set to 1 after the initialPLOTat line 120 — meaning every visible point after a clip or row-start triggers aPLOTand then aDRAWfrom the previous stored position. This is intentional: theDRAWat line 130 always executes regardless offl, connecting back tosx1/sy1.
Bugs and Anomalies
- The variable
lis set to 1 at line 120 (LET l=1) but is never read anywhere else in the program. This appears to be vestigial code, possibly a remnant from the original book listing wherelmay have tracked pen state more explicitly. - The
flflag is never set back to 1 after a successful plot, so after a clipped point the logic correctly starts a new stroke, but between unclipped points theDRAWat line 130 runs unconditionally regardless offl‘s value. The visual result is still correct becausesx1/sy1are updated at line 135 and the relative draw connects adjacent projected points. - The initial values
sx1=0,sy1=170(lines 5 and 145) are arbitrary starting points for the firstDRAWof each row; the first segment of each row will draw from this fixed screen position, which may produce stray lines at the beginning of each x-iteration.
Content
Image Gallery
Source Code
    1 REM  this proqram 6.4
    2 REM draws a surface z=f(x,y)
    3 BRIGHT 1
    4 LET ink=0
    5 LET sx1=0: LET sy1=170
    6 INK 7
    7 REM converted to T/S 2068           by  James N. Jones                  2242 Locust                     Amarillo, Texas 79109
    8 REM from the book by Myers          Microcomputer Graphics
   10 GO TO 40
   20 LET xe=-x*s1+y*c1: LET ye=-x*c1*c2-y*s1*c2+z*s2: LET ze=-x*s2*c1-y*s2*s1-z*c2+rho
   30 LET sx=d*xe/ze+cx: LET sy=cy+d*ye/ze: RETURN
   40 LET rho=30: LET d=350: LET theta=.3: LET phi=1: LET cx=127: LET cy=87: LET s1=SIN (theta): LET s2=SIN (phi): LET c1=COS (theta): LET c2=COS (phi)
   50 DEF FN z(x)=COS (.1*(x*x+y*y))
   60 REM color
   70 FOR x=10 TO -10 STEP -1
   80 LET fl=0
   90 FOR y=-10 TO 10
  100 LET z=FN z(x): GO SUB 20
  110 IF sx<0 OR sx>255 OR sy<0 OR sy>175 THEN LET fl=0: GO TO 140
  120 IF fl=0 THEN LET l=1: PLOT sx,sy
  130 DRAW (sx1-sx),(sy1-sy)
  135 LET sx1=sx: LET sy1=sy
  136 INK 0
  140 NEXT y
  145 INK 7: LET sx1=0: LET sy1=170
  150 NEXT x
 9998 SAVE "DROP" LINE 1
Note: Type-in program listings on this website use ZMAKEBAS notation for graphics characters.