A simulation of Mendel’s laws of inheritance.
This program simulates population genetics for a community of mice, modelling Hardy-Weinberg allele frequency changes across up to 50 generations. It uses a UDG character (redefined as a mouse glyph via eight bytes POKEd into USR “m”) to visually represent individual mice on screen. Selection pressure against either phenotype is configurable as a percentage, which is converted to a survival probability multiplier applied to each individual during the culling phase. A scrolling graph plots the frequency of the yellow allele (%y) over generations, with axis tick marks drawn using PLOT and DRAW primitives; when 50 generations are reached, the graph resets with the current allele frequency as the new starting point.
Program Structure
The program is divided into clearly separated functional blocks:
- Lines 1–30: Initialisation, UDG setup (via
GO SUB 9000), and introductory text screens. - Lines 40–77: User input — maximum population, selection direction (
d), selection strength (sp), and starting yellow allele frequency (y). - Lines 100–305: Main simulation loop driving
GO SUB 1000(breed) andGO SUB 2000(cull), with keypress dispatch. - Lines 1000–1070: Subroutine — generates the doubled population, assigns genotypes randomly, prints UDG mice.
- Lines 2000–2100: Subroutine — applies selection, removes individuals, recalculates allele frequency.
- Lines 5000–5020: Keypress wait subroutine (busy-wait on
INKEY$, then capture). - Lines 6000–6215: Graph-drawing subroutine using
PLOT/DRAW. - Lines 9000–9025: UDG definition subroutine, loads eight bytes into
USR "m".
Population Genetics Model
The simulation uses a per-individual random mating model rather than the analytical Hardy-Weinberg formula. Each mouse’s genotype is determined at line 1020:
LET z=(x>=y)+(v>=y)where x and v are independent uniform random numbers and y is the current yellow allele frequency. Each comparison yields 0 (yellow allele) or 1 (black allele), so z ∈ {0,1,2} representing yy, Yy/yY, or YY. Phenotype is stored as a string character in a$(f): "0" for yellow, "1" or "2" for black.
Selection Mechanism
Lines 2006–2072 implement viability selection. A scaling ratio r = p0 / (sb·bm + sy·ym) normalises survival so total expected survivors ≈ p0. Each individual survives if RND ≤ r·s_type, where sb and sy are the fitness coefficients for black and yellow mice respectively (set to s/100 for the selected-against type, 1.0 for the favoured type). When r > 1 it is clamped to 1 (line 2007), preventing survival probabilities exceeding 100%.
The surviving population count ps feeds back into the next generation size via p = MIN(p0, ps) at line 2098, so catastrophic culls reduce future breeding population.
Allele Frequency Tracking
Yellow allele frequency y is recalculated twice per generation:
- After breeding (line 1060):
y = (4p − cd) / (4p), wherecdaccumulates black allele counts (zvalues) and4pis the total allele count in2pdiploid individuals. - After culling (line 2090):
y = (2·ps − cd) / (2·ps), adjustingcdas dead black mice have their allele contributions subtracted at line 2071.
Each generation’s post-cull frequency is stored in array b() (dimensioned to 51 at line 1) for graph plotting.
Graph Subroutine
The graph (lines 6000–6215) plots %y on the Y axis (0–100, mapped to pixel rows 36–156, a span of 120 pixels) against generation number on the X axis (0–50, mapped to columns 47–247, step 4 pixels per generation). Tick marks are drawn with short DRAW calls. Data points are plotted with PLOT OVER 1 and a 3-pixel wide mark (DRAW OVER 1;3,0) to make them visible. When generation 50 is reached, the graph resets (n=1, b(1)=y) but the simulation continues.
UDG Mouse Glyph
The subroutine at line 9000 reads eight bytes from a DATA statement and POKEs them into the eight-byte block starting at USR "m", redefining UDG “m” as a mouse icon. The bytes 0,9,6,62,124,124,128,254 produce the glyph used throughout the display. The UDG is referenced in PRINT statements as the zmakebas escape \m.
Notable Techniques and Idioms
POKE 23692,255(line 270) prevents the “scroll?” prompt by resetting the line counter in the system variable SCRCT, a standard Spectrum BASIC trick.DIM a$(250)at line 1 allocates a fixed-length string array to store per-individual genotype codes ("0","1","2", or"d"for dead); this avoids repeated string concatenation.- The keypress subroutine at line 5000 first busy-waits for key release, then captures the next keypress into
I$— preventing key repeats from driving the menu. - The variable
I$(capital I) is used in some comparisons whilei$(lower-case) is used in others (lines 285, 290, 300); on the Spectrum these are distinct variables, meaning the branch at line 290 testsI$andi$simultaneously —i$will always be empty here since it is never assigned inGO SUB 5000, so thei$="M"test never triggers. Only theI$="m"branch works correctly.
Content
Image Gallery
Source Code
1 DIM a$(250): DIM b(51)
20 GO SUB 9000
24 BORDER 7: PAPER 7: CLS
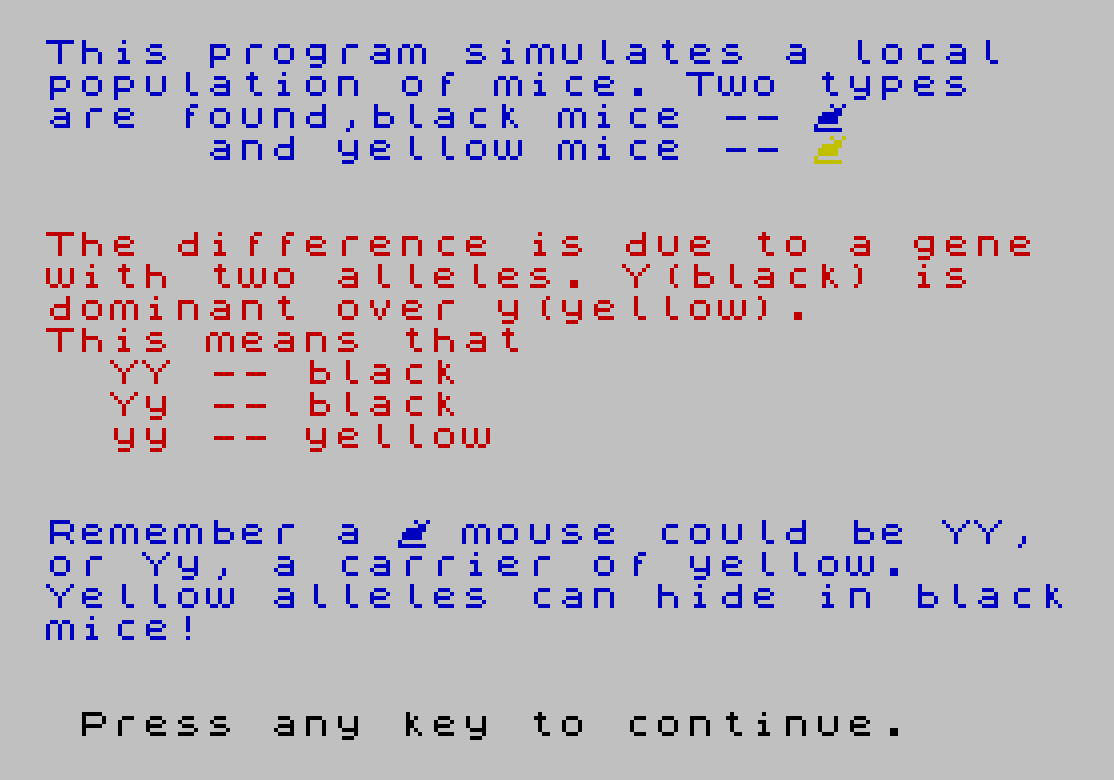
25 PRINT INK 1;"This program simulates a local"'"population of mice. Two types"'"are found,black mice -- \m"'" and yellow mice -- "; INK 6;"\m"''' INK 2;"The difference is due to a gene"'"with two alleles. Y(black) is"'"dominant over y(yellow)."'"This means that"'" YY -- black"'" Yy -- black"'" yy -- yellow"''' INK 1;"Remember a \m mouse could be YY,"'"or Yy, a carrier of yellow."'"Yellow alleles can hide in black"'"mice!"''' INK 0;" Press any key to continue."
26 IF INKEY$="" THEN GO TO 26
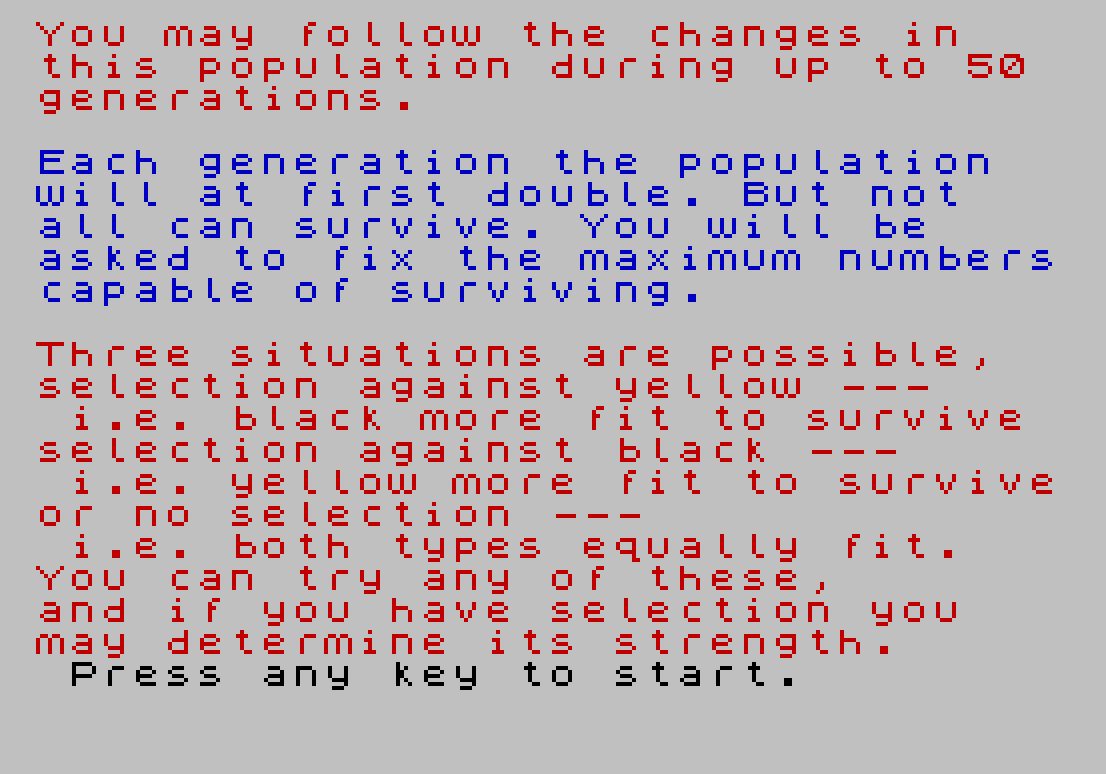
27 CLS : PRINT INK 2;"You may follow the changes in"'"this population during up to 50"'"generations."'' INK 1;"Each generation the population"'"will at first double. But not"'"all can survive. You will be"'"asked to fix the maximum numbers"'"capable of surviving."
28 PRINT INK 2;'"Three situations are possible,"'"selection against yellow ---"'" i.e. black more fit to survive"'"selection against black ---"'" i.e. yellow more fit to survive"'"or no selection ---"'" i.e. both types equally fit."
29 PRINT INK 2;"You can try any of these,"'"and if you have selection you"'"may determine its strength."' INK 0;" Press any key to start."
30 IF INKEY$="" THEN GO TO 30
40 BORDER 7: PAPER 7: CLS
50 PRINT AT 7,0; INK 2;"Enter the maximum population"'"that the enviroment can hold,"'"any number up to 125:"
52 INPUT p0: IF p0<1 OR p0>125 THEN PRINT INK 0;''"Must be between 0 and 125.": GO TO 52
55 CLS : PRINT AT 7,0; INK 1;"Selection could be"''" Against yellow Enter 0"'" Against black Enter 1"'" Or no selection Enter 2"
57 INPUT d: IF d<>0 AND d<>1 AND d<>2 THEN PRINT INK 0;''"Must be 0, 1 or 2": GO TO 57
58 IF d=2 THEN GO TO 75
60 CLS : PRINT AT 7,0; INK 2;"What is the strength of"'"selection measured as a %?"''"(100% would mean that the unfit"'"type is lethal)"''"Enter a number up to 100"
62 INPUT sp: IF sp<0 OR sp>100 THEN PRINT INK 0;''"Must be between 0 and 100": GO TO 62
70 LET s=100-sp
75 CLS : PRINT AT 7,0; INK 1;"What is the starting % of"'"yellow alleles? --- (%y)"''"(Remember that many will"'"be hidden in black mice!)"''"Enter a number up to 100"
77 INPUT y: IF y<0 OR y>100 THEN PRINT INK 0;"Must be between 0 and 100": GO TO 77
100 LET n=1: LET p=p0
110 LET y=y/100: LET b(1)=y
200 LET sb=1: LET sy=1: IF d=0 THEN LET sy=s/100
201 IF d=1 THEN LET sb=s/100
215 BORDER 7: PAPER 7: CLS
220 LET n=n+1: GO SUB 1000
265 GO SUB 2000
268 IF n=51 THEN PAUSE 120: GO TO 310
270 POKE 23692,255
280 PRINT BRIGHT 1; INK 0;" PRESS M FOR MORE, G FOR GRAPH "
285 GO SUB 5000
290 IF I$="m" OR i$="M" THEN GO TO 215
300 IF i$="g" OR i$="G" THEN GO TO 310
305 GO TO 285
310 GO SUB 6000
311 GO SUB 5000
315 IF i$="m" OR i$="M" THEN GO TO 215
320 IF i$="n" OR i$="N" THEN GO TO 40
325 IF i$="s" OR i$="S" THEN PAPER 7: STOP
350 GO TO 311
1000 PRINT AT 0,7; INK 2; BRIGHT 1;"NEXT GENERATION (";n-1;")"
1005 LET ym=0: LET cd=0: FOR f=1 TO 2*p
1010 LET x=RND: LET v=RND
1020 LET z=(x>=y)+(v>=y)
1030 LET cd=cd+z
1040 LET a$(f)=STR$ (z)
1045 LET i=0: IF a$(f)="0" THEN LET i=6: LET ym=ym+1
1046 PRINT INK 1;"\m ";
1050 NEXT f
1060 LET y=(4*p-cd)/(4*p)
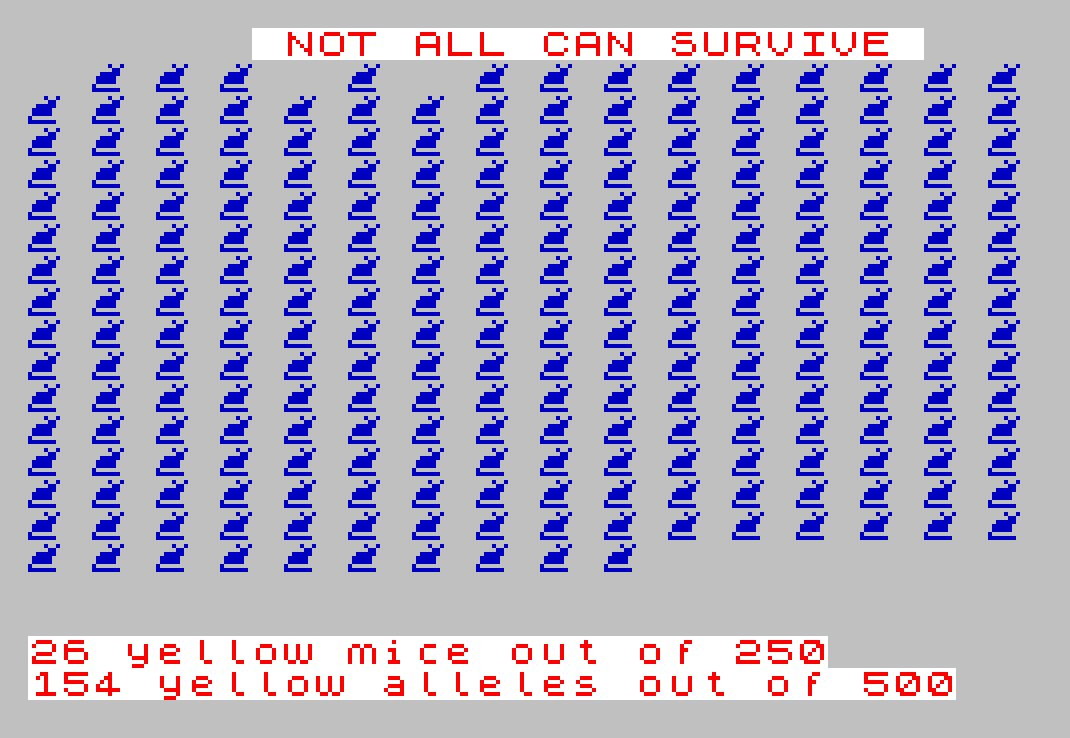
1065 PRINT AT 19,0; INK 2; BRIGHT 1;ym;" yellow mice out of ";(2*p)'(4*p-cd);" yellow alleles out of ";(4*p)
1070 RETURN
2000 PAUSE 150: PRINT AT 0,7; INK 2; BRIGHT 1; FLASH 1;" NOT ALL CAN SURVIVE "
2005 LET ps=2*p: LET bm=2*p-ym: LET bm1=bm: LET ym1=ym
2006 LET r=p0/(sb*bm+sy*ym)
2007 IF r>1 THEN LET r=1
2010 FOR f=1 TO 2*p
2060 LET x=RND
2071 IF ((a$(f)>"0") AND (x>r*sb)) THEN LET cd=cd-VAL (a$(f)): LET bm1=bm1-1: LET a$(f)="d": LET ps=ps-1: PRINT " ";
2072 IF ((a$(f)="0") AND (x>r*sy)) THEN LET ym1=ym1-1: LET a$(f)="d": LET ps=ps-1: PRINT " ";
2075 IF a$(f)<>"d" THEN PRINT OVER 1; INK 8;" ";
2080 NEXT f
2082 PRINT AT 20,31;" "
2083 PRINT AT 0,0;" "
2084 IF bm=0 THEN PRINT AT 19,0;" "
2085 IF bm>0 THEN PRINT AT 19,0; BRIGHT 1; INK 2;bm1;" BLACK SURVIVED FROM ";bm; INK 1;TAB (28);INT (100*bm1/bm+.5);"%"
2086 IF ym>0 THEN PRINT AT 20,0; BRIGHT 1; INK 2;ym1;" YELLOW SURVIVED FROM ";ym; INK 1;TAB (28);INT (100*ym1/ym+.5);"%"
2090 LET y=(2*ps-cd)/(2*ps): PRINT BRIGHT 1; INK 1;"%y=";(INT (y*1000+.5))/10;" (Last Generation =";(INT (b(n-1)*1000+.5))/10;")"
2095 LET b(n)=y
2098 LET p=p0: IF ps<=p0 THEN LET p=ps
2100 RETURN
5000 IF INKEY$="" THEN GO TO 5000
5020 LET I$=INKEY$: RETURN
6000 BORDER 1: PAPER 1: CLS : INK 7: PLOT 47,156: DRAW 0,-120: DRAW 200,0
6010 FOR f=36 TO 156 STEP 24: PLOT 45,f: DRAW -3,0: NEXT f
6020 FOR f=47 TO 247 STEP 40: PLOT f,36: DRAW 0,-4: NEXT f
6030 PRINT AT 9,0;"%y";AT 2,2;"100";AT 5,3;"80";AT 8,3;"60";AT 11,3;"40";AT 14,3;"20";AT 17,4;"0"
6040 PRINT AT 18,6;"0 10 20 30 40 50";AT 19,15;"Generation"
6050 PRINT AT 1,8;"Population max. ";p0
6060 IF d=2 THEN PRINT AT 0,10;"No selection "
6070 IF d=1 THEN PRINT AT 0,2;INT (sp);"% selection against black"
6080 IF d=0 THEN PRINT AT 0,1;INT (sp);"% selection against yellow"
6100 PLOT 46,120*b(1)+36: DRAW OVER 1;3,0
6110 FOR f=2 TO n: PLOT OVER 1;42+4*f,120*b(f)+36: NEXT f
6115 IF n=51 THEN GO TO 6200
6120 PRINT AT 20,0;"Press m for more,"'"n for new start, s to stop"
6130 INK 0: RETURN
6200 LET n=1: LET b(1)=y
6210 PRINT AT 19,0; FLASH 1;"GRAPH FULL "' FLASH 0;"Pressing m continues run, but"'"restarts graph (n=newrun,s=stop)"
6215 INK 0: RETURN
9000 DATA 0,9,6,62,124,124,128,254
9010 FOR f=0 TO 7
9015 READ gr
9020 POKE USR "m"+f,gr
9025 NEXT f: RETURN
9996 REM -----------------------
9997 REM From Dr E. Gingold Sinclair Programs, May 1983 by D.J. Currie
9998 SAVE "Genetics" LINE 1Note: Type-in program listings on this website use ZMAKEBAS notation for graphics characters.