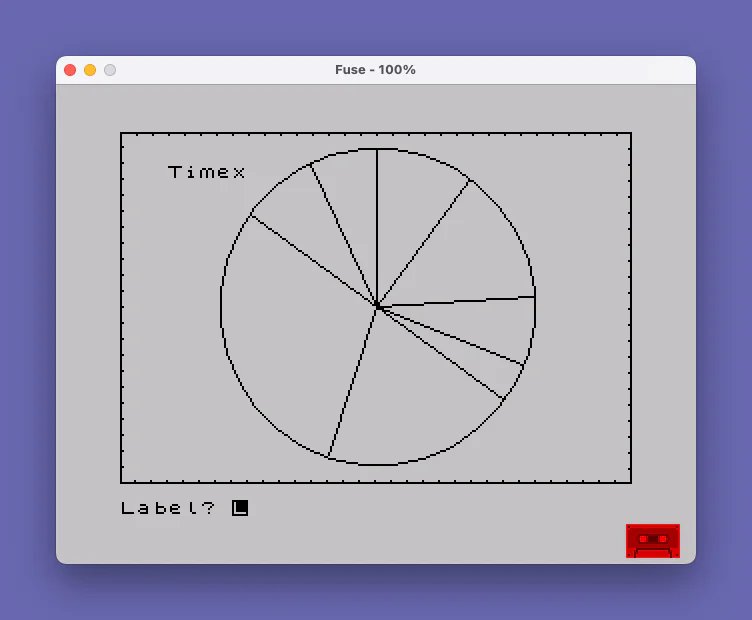
This program draws an interactive pie chart on screen, accepting percentage values from the user and rendering each slice as a radial line from the center of a circle. It uses CIRCLE and DRAW with trigonometric conversion (degrees to radians via PI) to position each dividing line at the correct cumulative angle. After data entry, the user can add text labels at arbitrary screen positions specified by row and column, then enter a centered title that is automatically positioned using the expression `(32-LEN z$)/2`. A decorative dotted border is drawn around the screen using four FOR/NEXT loops plotting points at regular intervals, and a corresponding eraser pass clears the border area before the title is displayed.
Program Analysis
Program Structure
The program divides into four logical phases:
- Chart drawing (lines 10–100): Draws the outer circle and baseline radius, then accepts percentage inputs in a loop, converting each to a cumulative angle and drawing a spoke.
- Border decoration (lines 200–240): Draws a solid rectangle border then overlays a dotted pattern using four FOR/NEXT loops stepping every 8 pixels.
- Label entry (lines 250–270): Prompts for a text label and screen coordinates; a
y=32sentinel exits the label loop. - Title entry (lines 400–460): Erases the top/right/bottom/left border strip using PRINT AT with spaces, then centers a title string in row 0 and halts.
Line 9999 is a standalone save/verify routine reachable only by direct RUN or GO TO, not by normal program flow.
Pie Slice Rendering
Each slice boundary is drawn as a straight line from the center (128,88) to the circle’s edge. The program accumulates the running total in t, converts the cumulative percentage to degrees with a=360*t/100, and then converts to Cartesian offsets:
- X offset:
78*SIN(a/180*PI) - Y offset:
78*COS(a/180*PI)
Using COS for the Y component and SIN for X starts the first slice at the top (12 o’clock) rather than the conventional right (3 o’clock). The radius used for DRAW (78) is one pixel less than the CIRCLE radius (79), which prevents the spoke endpoint from landing exactly on the circumference and avoids an OVER-1 erasure artifact.
Input Validation
Line 60 rejects negative percentages and any value that would cause the cumulative total to exceed 100, using the compound condition p<0 OR p>(100-t). The special case p=100 at line 50 is handled separately: it draws a spoke using DRAW OVER 1 (XOR mode), which erases the initial baseline radius drawn at line 10, neatly closing the full circle without a visible seam, then jumps directly to the border phase.
Border and Label Techniques
The decorative dotted border (lines 210–240) is drawn in pixel coordinates using PLOT in loops with a step of 8, creating a dashed effect around the 256×176 pixel display area. The title-display phase (lines 400–430) erases this border by printing spaces via PRINT AT over the corresponding character-cell rows and columns — a common technique to clear a pixel-drawn element without a full CLS.
The multi-item INPUT at line 250 uses a semicolon-separated prompt list to collect the label string, row, and column in a single statement: INPUT "Label? "; LINE a$;"Position? ";x;" ";y. The LINE keyword prevents the Spectrum INPUT parser from treating leading spaces or special characters in the label as keywords.
Title Centering
Line 450 centers the title using AT 0,(32-LEN z$)/2. This is a standard idiom for 32-column centering; integer truncation means odd-length strings are placed one column to the left of true center, which is visually acceptable.
Notable Anomalies
| Line | Issue |
|---|---|
200 | DRAW 255,0 from PLOT 0,0 attempts to reach pixel 255 — just within the 256-pixel-wide screen — but DRAW -255,0 from (255,175) will reach pixel 0 correctly. The rectangle is drawn in pixel space, consistent with the rest of the chart. |
250 | The sentinel condition y=32 is only checked after both x and y are entered; there is no way to abort without supplying all three input fields. |
460 | STOP is used rather than a GO TO a non-existent line or simply falling off the end, which will display a 9 STOP statement error report — functional but slightly inelegant. |
Content
Image Gallery
Source Code
    5 REM pie chart                      ZX-Appeal Oct. 1986             Vancouver Sinclair UG
   10 CIRCLE 128,88,79: PLOT 128,88: DRAW 0,78
   20 LET t=0
   30 INPUT "Percentage of Circle?(-1 to end) ";p
   40 IF p=-1 THEN GO TO 200
   50 IF p=100 THEN PLOT OVER 1;128,88: DRAW OVER 1;0,70: GO TO 200
   60 IF p<0 OR p>(100-t) THEN GO TO 30
   70 LET t=t+p
   80 LET a=360*t/100
   90 PLOT 128,88: DRAW (78)*SIN (a/180*PI),(78)*COS (a/180*PI)
  100 GO TO 30
  200 PLOT 0,0: DRAW 255,0: DRAW 0,175: DRAW -255,0: DRAW 0,-175
  210 FOR t=0 TO 255 STEP 8: PLOT t,174: NEXT t
  220 FOR r=175 TO 0 STEP -8: PLOT 254,r: NEXT r
  230 FOR b=255 TO 0 STEP -8: PLOT b,1: NEXT b
  240 FOR l=0 TO 175 STEP 8: PLOT 1,l: NEXT l
  250 INPUT "Label? "; LINE a$;"Position? ";x;" ";y: IF y=32 THEN GO TO 400
  260 PRINT AT x,y;a$
  270 GO TO 250
  400 FOR t=0 TO 31: PRINT AT 0,t;" ";: NEXT t
  410 FOR r=0 TO 21: PRINT AT r,31;" ";: NEXT r
  420 FOR b=31 TO 0 STEP -1: PRINT AT 21,b;" ";: NEXT b
  430 FOR l=21 TO 0 STEP -1: PRINT AT l,0;" ";: NEXT l
  440 INPUT LINE z$
  450 PRINT AT 0,(32-LEN z$)/2;z$
  460 STOP
 9999 CLEAR : CLS : SAVE "pie chart": BEEP 1,32: PRINT "Rewind to VERIFY.": VERIFY "": PRINT : PRINT FLASH 1;" V E R I F I E D ": BEEP .2,30
Note: Type-in program listings on this website use ZMAKEBAS notation for graphics characters.