Sound Scanner is a BASIC program that samples audio signals from the tape input port and displays them as a waveform on screen. It offers three display modes: a normal line graph, a block graph, and a dot graph, selectable at startup. The program uses a short machine code routine (18 bytes, POKEd into memory at address 32600) to read the EAR port (IN 254) and return a level value via USR, which drives the plotting. Screen positions are stepped in increments of 4 pixels across the 256-pixel horizontal range, and a user-defined function `FN a(l)` maps the signal level to one of eight INK colors for the waveform.
Program Analysis
Program Structure
The program is organized into a handful of logical sections. Lines 102–103 define the color-mapping function and call the machine code installer. Line 105 calls the main menu routine. Lines 110 and 120 are the two conditional drawing subroutines (normal graph and block graph respectively), each ending with RETURN. Lines 200–230 handle the menu display and option input. Lines 250–275 form the main scanning loop. Lines 300–320 implement the freeze/pause menu. Lines 400–410 hold the machine code data and the installation routine.
Machine Code Routine
The 18 bytes in the DATA statement at line 400 are POKEd into address 32600 by the loop at lines 405–410. When called via USR tone, this routine samples the EAR input port. Disassembling the bytes:
01 00 FF— LD BC, $FF00 (sets up BC; B=255 as a counter, C=0 as accumulator)11 00 00— LD DE, 0 (initialize DE)DB FE— IN A, ($FE) (read the EAR/MIC port)CB 77— BIT 6, A (test the EAR bit)20 01— JR NZ, +1 (skip next if EAR high)13— INC DE (count high samples)10 F7— DJNZ (loop 255 times)42— LD B, D4B— LD C, E (move result to BC for USR return)C9— RET
The routine samples the EAR port 255 times in a tight loop, counting how many times bit 6 is set, and returns that count in BC (the value returned to BASIC by USR). The result is divided by 2 in line 255 (LET L=USR tone/2) to scale it to the screen height range.
Main Scanning Loop
Lines 250–275 form the core display loop. FOR N=0 TO 255 STEP 4 sweeps 64 horizontal positions across the screen. At each position, the EAR level L is sampled and a point is plotted with PLOT n,l. If option 1 or 2 is selected, a subroutine is called via GO SUB 100+(q*10), which dispatches to line 110 (normal graph) or line 120 (block graph) depending on the value of q. Option 3 (dot graph) uses only the bare PLOT without connecting lines.
Drawing Subroutines
Line 110 implements the normal graph: it draws a line from the previous plot point (x,y) to the new point using DRAW INK FN a(l); x-n, -l+y, then updates x and y for the next iteration. Line 120 implements the block graph with a simpler vertical line from the baseline: DRAW INK FN a(l); 0, -l. Both subroutines use the INK parameter of DRAW to color the line dynamically based on signal level.
Color Mapping with FN a
The user-defined function at line 102, DEF FN a(l)=1+INT(.5+l/30), maps the signal level l (0–127 range after halving) to an INK color value from 1 to approximately 5. This produces a rough spectral coloring of the waveform where higher amplitude signals receive higher ink color indexes, giving a visual intensity cue without any additional computation.
Variable Naming Anomaly
The program uses both I$/i$ and X/x, Y/y, N/n, I$/I$ inconsistently in case. In Sinclair BASIC, variable names are case-insensitive for numeric variables but the system stores them in a single canonical form, so this causes no runtime error. However, the mixing of upper and lower case across lines (e.g., LET X=0 in line 250 and LET x=n in line 110) is stylistically inconsistent.
Freeze and Menu Control
Pressing SPACE during scanning (detected by INKEY$ at line 265) jumps to line 300, which displays pause options. From there, m triggers RUN to restart the whole program, r resumes scanning at line 270 (mid-loop, effectively restarting the FOR loop from its last NEXT), and e is listed in the on-screen prompt but has no corresponding handler — pressing e simply falls through to GO TO 300, making “END” a non-functional option.
Key Variables Summary
| Variable | Purpose |
|---|---|
tone | Base address (32600) of machine code routine |
q | Selected graph type (1=normal, 2=block, 3=dot) |
n/N | Current horizontal screen position (0–255, step 4) |
l/L | Sampled audio level (0–127) |
x/X, y/Y | Previous plot coordinates for line drawing |
i$/I$ | Keypress detection variable |
Content
Image Gallery

Source Code
100 REM soundscanner
102 DEF FN a(l)=1+INT (.5+l/30)
103 GO SUB 405
105 GO SUB 200
110 DRAW INK FN a(l);x-n,-l+y: LET x=n: LET y=l: RETURN
120 DRAW INK FN a(l);0,-l: RETURN
200 PAPER 0: INK 7: BRIGHT 1: CLS
210 PRINT AT 1,9; INVERSE 1;"SOUND SCANNER"
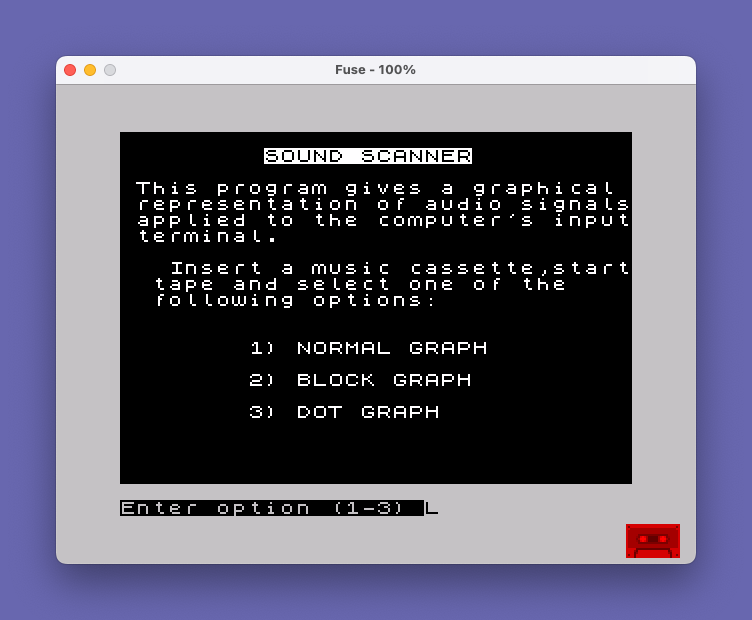
215 PRINT AT 3,1;"This program gives a graphical representation of audio signals applied to the computer's input terminal."
220 PRINT AT 8,1;" Insert a music cassette,start tape and select one of the following options:"
225 PRINT AT 13,8;"1) NORMAL GRAPH";AT 15,8;"2) BLOCK GRAPH";AT 17,8;"3) DOT GRAPH"
230 INPUT INVERSE 1;"Enter option (1-3) ";q: IF q<1 OR q>3 THEN GO TO 230
250 CLS : PRINT AT 0,7; INVERSE 1;"'SPACE' TO FREEZE": LET I$="": LET X=0: LET Y=0
255 FOR N=0 TO 255 STEP 4: LET L=USR tone/2: PLOT n,l:
260 IF q<3 THEN GO SUB 100+(q*10)
265 LET i$=INKEY$: IF i$=" " THEN GO TO 300
270 NEXT n
275 GO TO 250
300 PRINT AT 0,5; INVERSE 1;"M=MENU R=RESTART E=END"
305 LET I$=INKEY$: IF I$="m" THEN RUN
310 IF I$="r" THEN GO TO 270
320 GO TO 300
400 DATA 1,0,255,17,0,0,219,254,203,119,32,1,19,16,247,66,75,201
405 LET tone=32600
410 FOR n=tone TO tone+17: READ d: POKE n,d: NEXT n: RETURN Note: Type-in program listings on this website use ZMAKEBAS notation for graphics characters.