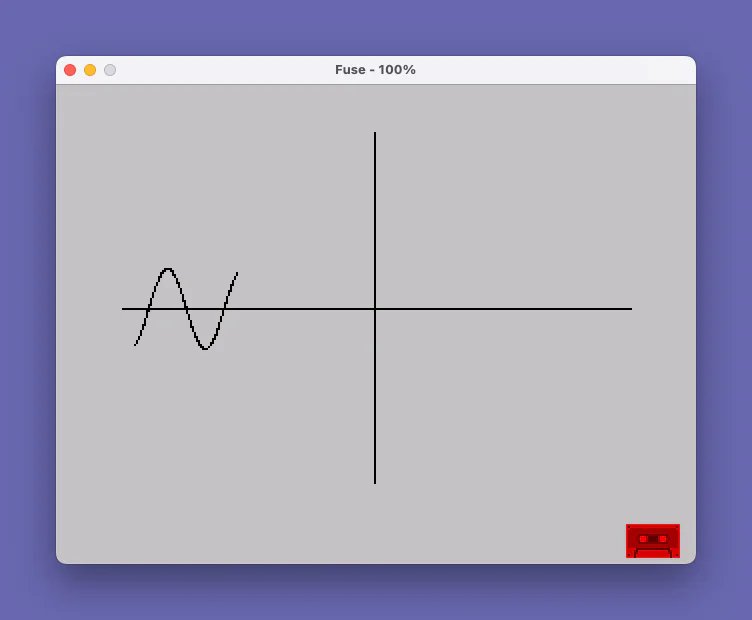
This program draws a sine wave on the screen by first rendering horizontal and vertical axes, then plotting points using the parametric form PLOT I*6+127, 87+20*SIN I. The horizontal axis spans the full screen width (1 to 255 pixels), and the vertical axis is centered at pixel row 87, which is roughly mid-screen. The sine wave loop runs from -20 to 20 radians in steps of 0.03, scaling the output horizontally by a factor of 6 and with an amplitude of 20 pixels. Line 100 appears to be an incomplete or truncated continuation of the program, suggesting the listing may be cut off.
Program Analysis
Program Structure
The program is divided into four functional stages executed sequentially:
- Lines 12–30: Draw the horizontal axis at pixel row 87 across the full screen width.
- Lines 40–60: Draw the vertical axis at pixel column 127, spanning the full screen height.
- Lines 70–90: Plot the sine wave using a floating-point parameter loop.
- Line 100: An incomplete or truncated
FORloop, suggesting the listing is cut short.
Axis Rendering
The horizontal axis is drawn by iterating X from 1 to 255 and plotting at row 87, which sits near the vertical midpoint of the 176-pixel-high screen (the true midpoint would be 88). The vertical axis is drawn at column 127, close to the horizontal center of the 256-pixel-wide screen. These two lines form a coordinate cross that provides visual context for the sine wave.
Sine Wave Plotting
The sine wave is drawn by the loop at lines 70–90. The parameter I runs from -20 to 20 radians in steps of 0.03, giving approximately 1,334 plotted points. The horizontal coordinate is computed as I*6+127, centering the wave around column 127 and spreading roughly ±120 pixels. The vertical coordinate is 87+20*SIN I, giving an amplitude of 20 pixels above and below the axis. The range of ±20 radians covers approximately ±3.18 full cycles of the sine function, producing a dense, multi-cycle wave across the screen.
Key BASIC Idioms and Techniques
- Direct use of
PLOTfor pixel-level graphics without anyDRAWorCIRCLEcommands, giving full control over the curve shape. - The floating-point
STEP .03in theFORloop is used to achieve smooth point density; a larger step would produce a visibly gapped curve. - The
REMat line 11 serves as a program title label with no functional effect. - Variable naming mixes uppercase (
X,Y,I) inconsistently — line 12 uses lowercasexwhile line 20 uses uppercaseX; on this platform these are the same variable.
Anomalies and Notes
Line 100 begins a FOR x=1 TO 255 loop but has no corresponding body or NEXT statement in the listing, indicating the program is incomplete as shown. It may have been intended to redraw the horizontal axis, pause, or perform an animation clear. As listed, the program will halt or error at line 100 when it attempts to execute a FOR loop with no subsequent statements before the program ends.
| Lines | Purpose | Key Variables |
|---|---|---|
| 11 | REM label | — |
| 12–30 | Horizontal axis | x / X |
| 40–60 | Vertical axis | Y |
| 70–90 | Sine wave plot | I |
| 100 | Incomplete loop (listing truncated) | x |
Content
Image Gallery
Source Code
   11 REM sinewave
   12 FOR x=1 TO 255
   20 PLOT X,87
   30 NEXT X
   40 FOR Y=0 TO 175
   50 PLOT 127,Y
   60 NEXT Y
   70 FOR I=-20 TO 20 STEP .03
   80 PLOT I*6+127,87+20*SIN I
   90 NEXT I
  100 FOR x=1 TO 255
Note: Type-in program listings on this website use ZMAKEBAS notation for graphics characters.