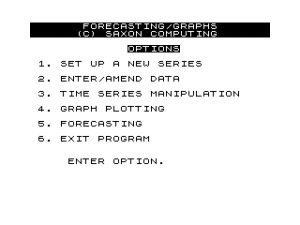
Takes raw data and projects sales, profits, inflation, and other trends. Computes a moving average that smooths out seasonal and random fluctuations. Stores up to 15 time series of 60 periods each. Analyzes growth rates, correlates two separate trends, computes mean and standard deviation. Results can be displayed in graph form. 16K.
Forecasting and Graphs