
Generally, a mathematical model is a representation of some real-life process, expressed in mathematical form (such as a set of related equations) or in algorithmic form (such as a computer program). Usually the model is by necessity a simplification of the actual process, since real-life processes tend to be highly complex. One advantage of embodying the model as a computer program is that we can run the program and thus simulate the process being modelled. By varying certain features of the program, we can learn something about the relationships between the componenets and the overall structure of the process. In addition, if the output does not sufficiently coincide with observed reality, the model can be revised and improved.
It is also possible to model a purely abstract process. We don’t often see this done. After all, if someone asked you to describe some abstract process, what would you say? However, many games start out as purely abstract processes. For example, tic-tac-toe or checkers are abstract from the point of view that they represent no real-life process. Occasionally, it turns out that an abstract process represents a real-life process either by accident or design. The following game is one such example which in some ways represents life itself.
The game of Life was devised by John Conway, a mathematician at the University of Cambridge, and made popular by a series of articles written by Martin Gardner in recent issues of Scientific American. Ever since the first article appeared in October 1970, hundreds of mathematicians throughout the world have become fascinated with the model and have been exploring its properties.
The game consists of following the successive generations of a particular imaginary type of cellular life-form. The life processes of these cells are represented by the following mathematical model, which captures several properties common to all life-forms.
(1) World — Cells live on an infinite two-dimensional plane of squares (like an infinite checker-board, except that all squares are identical).
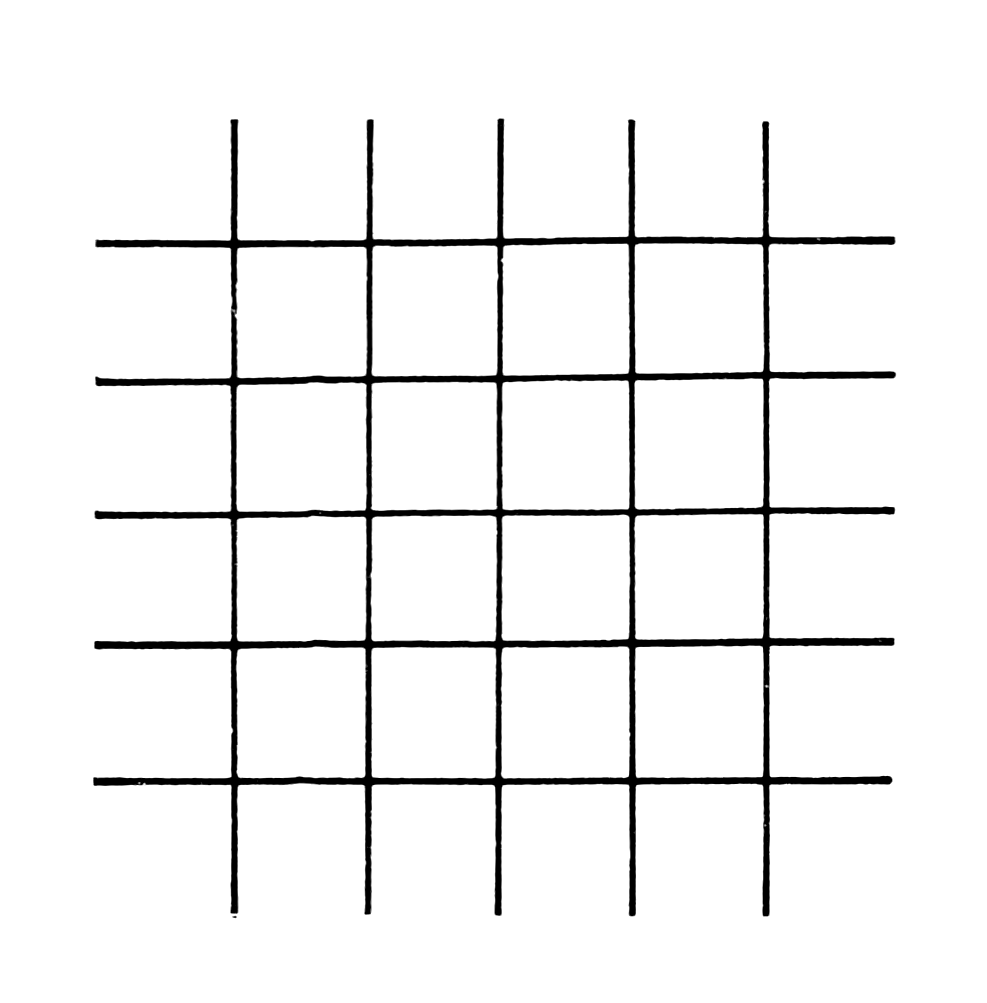
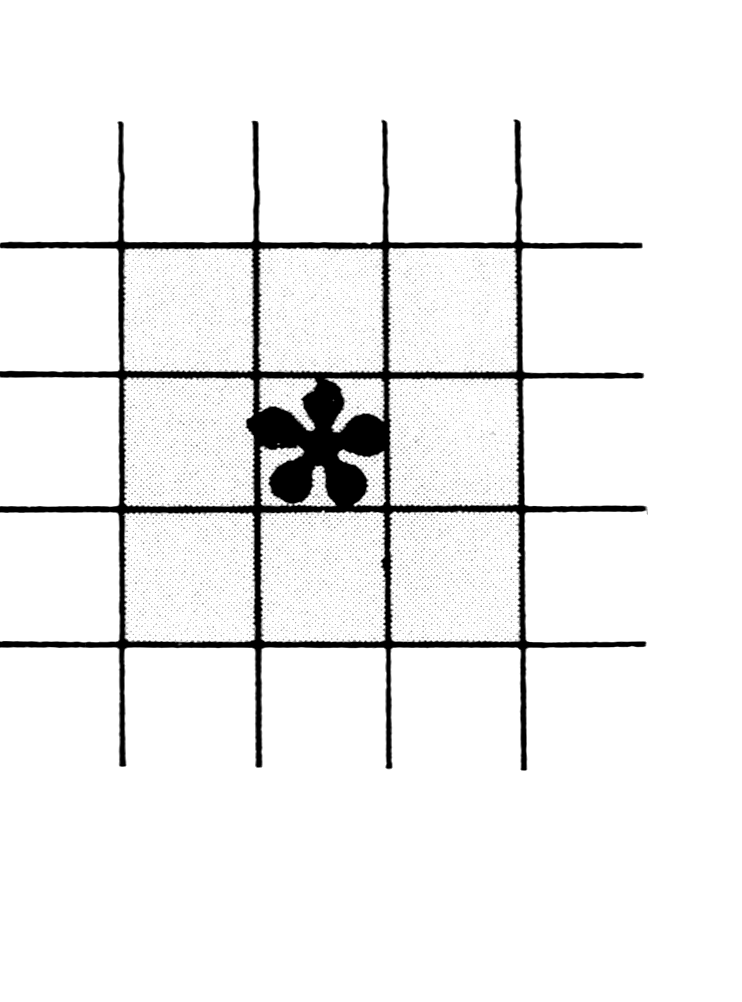
(2) Neighborhood — Each square has eight neighbor squares. In the diagram below, the neighbor squares for the square with the asterisk (*) have been colored in.
(3) Survival — A cell (always represented by a *) which is living in generatin n, will remain living in generation n+1 if and only if it has exactly two or three living neighbors in generation n.
(4) Death — However, in all other cases the cell dies. Specifically: If it has one or no neighbors it dies from isolation. If it has four, more than three neighbors, it dies from overpopulation.
(5) Birth — If a square is empty during generation n, a living cell will be born into that square during generation n+1 if and only if that square had exactly three living neighbors during generation n.
The only trick is to remember that all survivals, deaths, and births occur simultaneously, and so the simplest way to keep the bookkeeping straight is to have two separate copies of the world — one for the old generation and one for the new one you are forming. For each square in the old world, decide what its state will be next time, and mark this down in the corresponding square in the new world.
The game is played simply by picking some initial starting pattern and watching the development of some very interesting, and often beautiful patterns of symmetry. However, the player must be extremely careful because mistakes are easy to make.
As an example, we will trace three generations of the following initial pattern (we have numbered some rows and columns for reference purposes only):
 1  2  3  4
 5  6* 7  8
 9 10*11*12
13 14 15*16
Following the rules of our model:
No births will occur in squares 1, 2, 3, 4, or 5 because none has three living neighbors.
The cell in square 6 will survive because it has two living neighbors (10 and 11).
A birth occurs in square 7 because there are three living neighbors (6, 10, and 11).
No birth occurs in squares 8 or 9.
The cell in square 10 survives because it has three living neighbors (6, 10, and 15).
The cell in square 11 survives also because it has three living neighbors (6, 10, and 15).
No birth occurs in squares 12 or 13.
A birth occurs in square 14 because there are three living neighbors (10, 11, and 15).
The cell in square 15 survives because it has two living neighbors (10 and 11).
No birth occurs in square 16 because it only has two living neighbors.
During this process, we have been filling in a picture of G1, and the end result is:
**
**
**
The following program for the game of Life is from The Melbourne House book, Thirty Programs for The Sinclair ZX-80 1K.
100 DIM A (63)
110 FOR I = 1 TO 63
120 LET A(I) = 128 * (RND (2) - 1)
130 NEXT I
200 FOR L = 0 TO 8
210 FOR J = 1 TO 7
220 LET I = J + 7 * L
230 PRINT CHR$ (A(I));
240 NEXT J
250 PRINT
260 NEXT L
270 PRINT "PRESS 1"
280 INPUT A
290 CLS
300 FOR I = 9 TO 55
310 LET X = 0
320 IF ((I + 1) AND 7) = 0 THEN GO TO 350
330 LET X = (A(I + 1) > 127)
340 IF ((I - 1) AND 7) = 0 THEN GO TO 360
350 LET X = X + (A(I - 1) > 127)
360 FOR J = 7 TO 9
370 FOR R = - 1 TO 1
380 IF R = 0 THEN GO TO 420
390 LET K = I + R * J
400 IF (K AND 7) = 0 THEN GO TO 420
410 LET X = X + (A(K) >127)
420 NEXT R
430 NEXT J
440 LET A(I) = A(I) - X
460 NEXT I
470 IF A(I) = 3 OR A(I) = 130 OR A(I) = 131 THEN GO TO 500
480 LET A(I) = 0
490 GO TO 510
500 LET A(I) = 128
510 NEXT I
520 GO TO 200
Experiment 1
Using pencil and paper, carefully compute G2, the next generation for this same society of cells. If you do it correctly, you will find that G2 is the pattern which Conway calls the “beehive”:
 **
*  *
 **
Experiment 2
Now compute G3. If you are again careful, you will discover that G3 is identical to G2. Why does Conway call the beehive a “still-life”? If you are not sure, think about G4, G5, G6…
Experiment 3
Using pencil and paper, compute G0, G1, G2 and G3 for the initial pattern below:
*
***
If you do it correctly, G3 should look familiar to you.
Experiment 4
By now you’ve no doubt noticed that with pencil and paper, this game is an extremely slow process, and mistakes are all too common. If we ever hope to look at more than a few patterns, we’re going to have to turn to the computer for help.
Write a computer program which simulates “Life” for any given initial pattern, and which has the following features:
(1) Allow for as large a world size as your particular computer facility will permit (obviously an infinite plane is not possible in a finite memory). You will probably want to use array structures with two subscripts (row and column).
(2) Whatever world-size you are limited to, make sure your program doesn’t try to alllow births outside your world, even though properly these would occur on an infinite plane.
(3) Make sure your algorithm allows all survivals, deaths, and births during a given generation to occur simultaneously, as discussed above.
(4) Allow the user to input the initial pattern in a convenient format, such as pairs of (row, column) coordinates.
(5) Make your program efficient and your output as close to the format of the pictures above as possible.
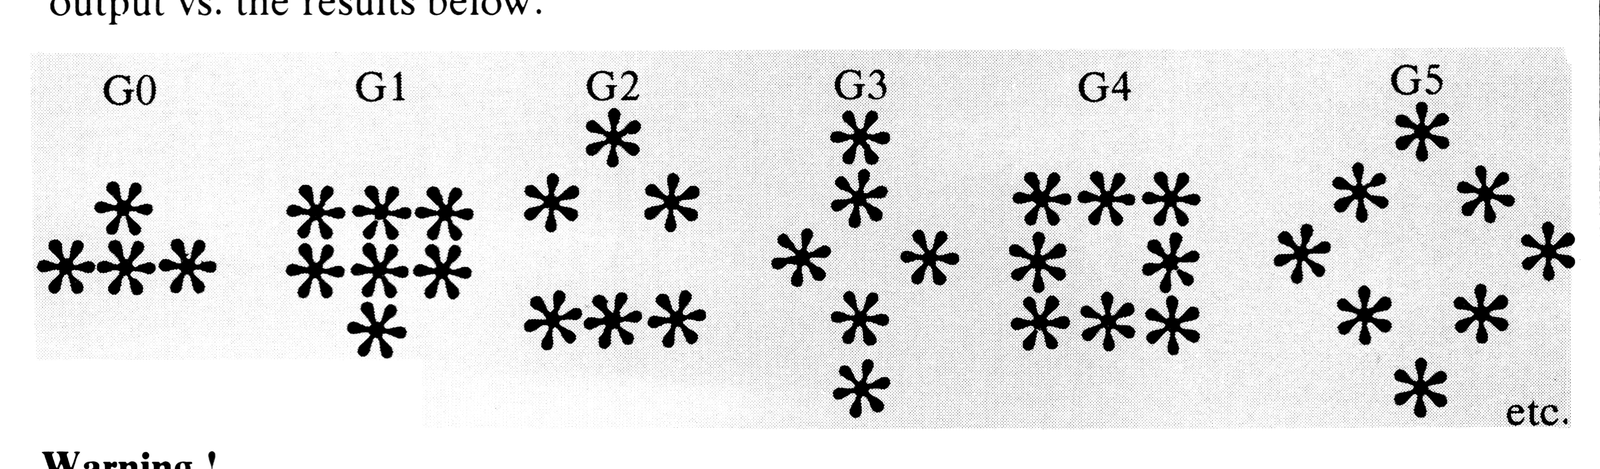
Once your algorithm is designed, and your program is written, debug your program by running it on the following initial GO pattern, and carefully check your output vs. the results below:
Warning !
Depending upon the world-size you are limited to, certain “large” patterns may grow differently than they would on an infinite plane.
If the society of cells above, however, fits inside your world-size, you will notice an interesting cyclic pattern beginning at G0, which Conway calls “traffic lights”.
Experiment 5
When your program is thoroughly debugged and operational, or using the LIFE program with this article, the real fun comes in thinking up initial patterns and watching them grow. Interesting situations to watch for are:
(1) Other “still-life societies (like the “bee-hive”)
(2) Other “cyclic” societies (like the “traffic lights”)
(3) A society which lives for an extended period of time without dying, becoming still, or cycling
Experiment 6
Find copies of the October 1970 and/or February 1971 issues of Scientific American and read Gardner’s articles on “Life.” You may want to run your program on some of the societies he describes, such as: diagonal chains, the R pentomino, the Latin cross, the cheshire cat, and many others.
Experiment 7
Try to think up changes in the model (and your computer program) which will drastically alter the life patterns of the cells, i.e. by modifying the rules for birth or death or both. Based upon your experience so far, try to come up with sets of rules which will lead to more populous societies, or more sparse societies, or societies which are less symmetric than those of “Life”, etc. The range of possibilities is very large.
Experiment 8
Make some major modifications in your computer program to make it more general, by allowing the user to specify the particular model he wants to investigate. For example, you might have your program begin by posing the following questions to the user:
How many neighbors for survival?
How many neighbors for birth?
Then, if the user answered 2, 3 for the first question and 3 for the second, your program would follow the rules of “Life.” But if he gave other answers, the program would simulate for him some other model he wants to investigate.
Experiment 9
Is there any way you can streamline your program or the published one so that you can enlarge the size of the world it currently handles?
Experiment 10
How might you alter the general concept of “neighborhood” so that entirely different models could be tested? How would your computer program have to be changed in order to simulate these new models?
Note: Type-in program listings on this website use ZMAKEBAS notation for graphics characters.