
WHAT?
Structured BASIC is BASIC which is organized so that each module or section of a program has ONE entry point and ONE exit point. The opposite of this, so-called “spaghetti” BASIC, is programming that has multiple entry and/or exit points in its modules.
Structured BASIC also requires that no low-level module call (GOSUB to) a higher-level module. RETURNs to the module which called the routine are needed, and are naturally allowed. If you do not understand these statements, please continue– as we explore structure, this point will become clear.
WHY?
Structured BASIC lends itself to easy maintainance and revision. This is true because the organized structure allows for rewriting one module without massive revisions elsewhere.
Further, it is easier to find and trace errors in branching if the program is structured. Not only that, but if each module is written as a single purpose module the location of logic errors becomes easier. Thus, structured BASIC is better because it is easier to debug, edit, and revise than “spaghetti”.
Structure Explained
Take a look at Figure 1 and then return to read on…. If you turn Figure 1 upside down it will look like a simple tree.
This structure has been developed from database theory. Some databases have a “tree” design, and the lines indicate access routes or paths. For the purposes of programming, the lines indicate control routes designed into the program.
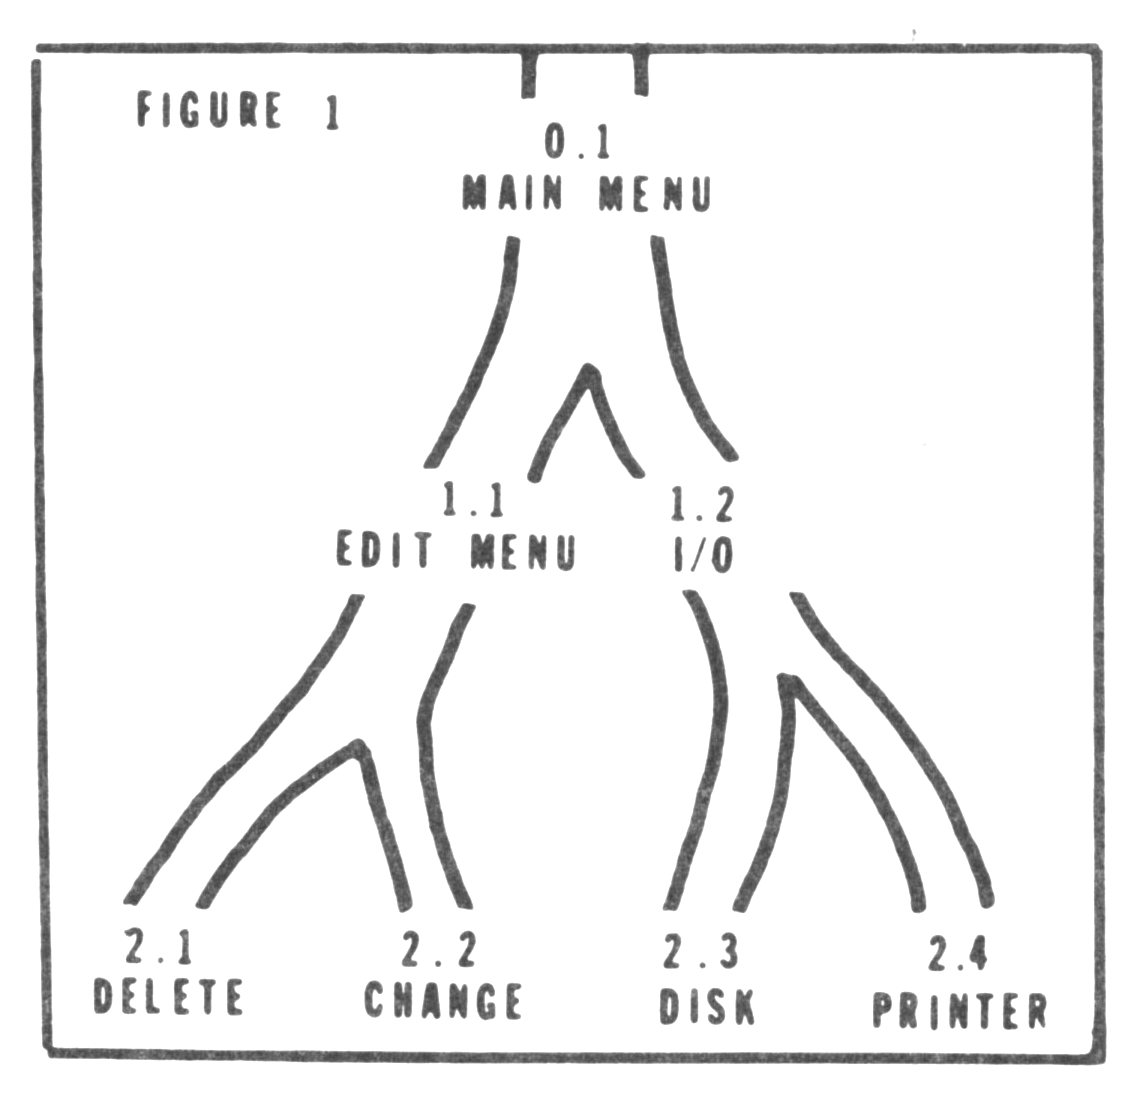
Figure 1 is simplified, in that each high level module only passes control to one of two lower level modules. In real life, each high level module could pass control to any one of several lower level modules. Further, each lower level module could pass control to any of several still lower level modules….
If you are confused at this point, look at Figure 1 and note that routine 0.1 could pass control to routine 1.1 or 1.2. If I had more space, I could have drawn in routines 1.3, 1.4, and 1.5 to the right of routine 1.2. Then, routine 0.1 could pass control to any one routine of the five (1.1-1.5). Get the idea?
Structure Charts Explained
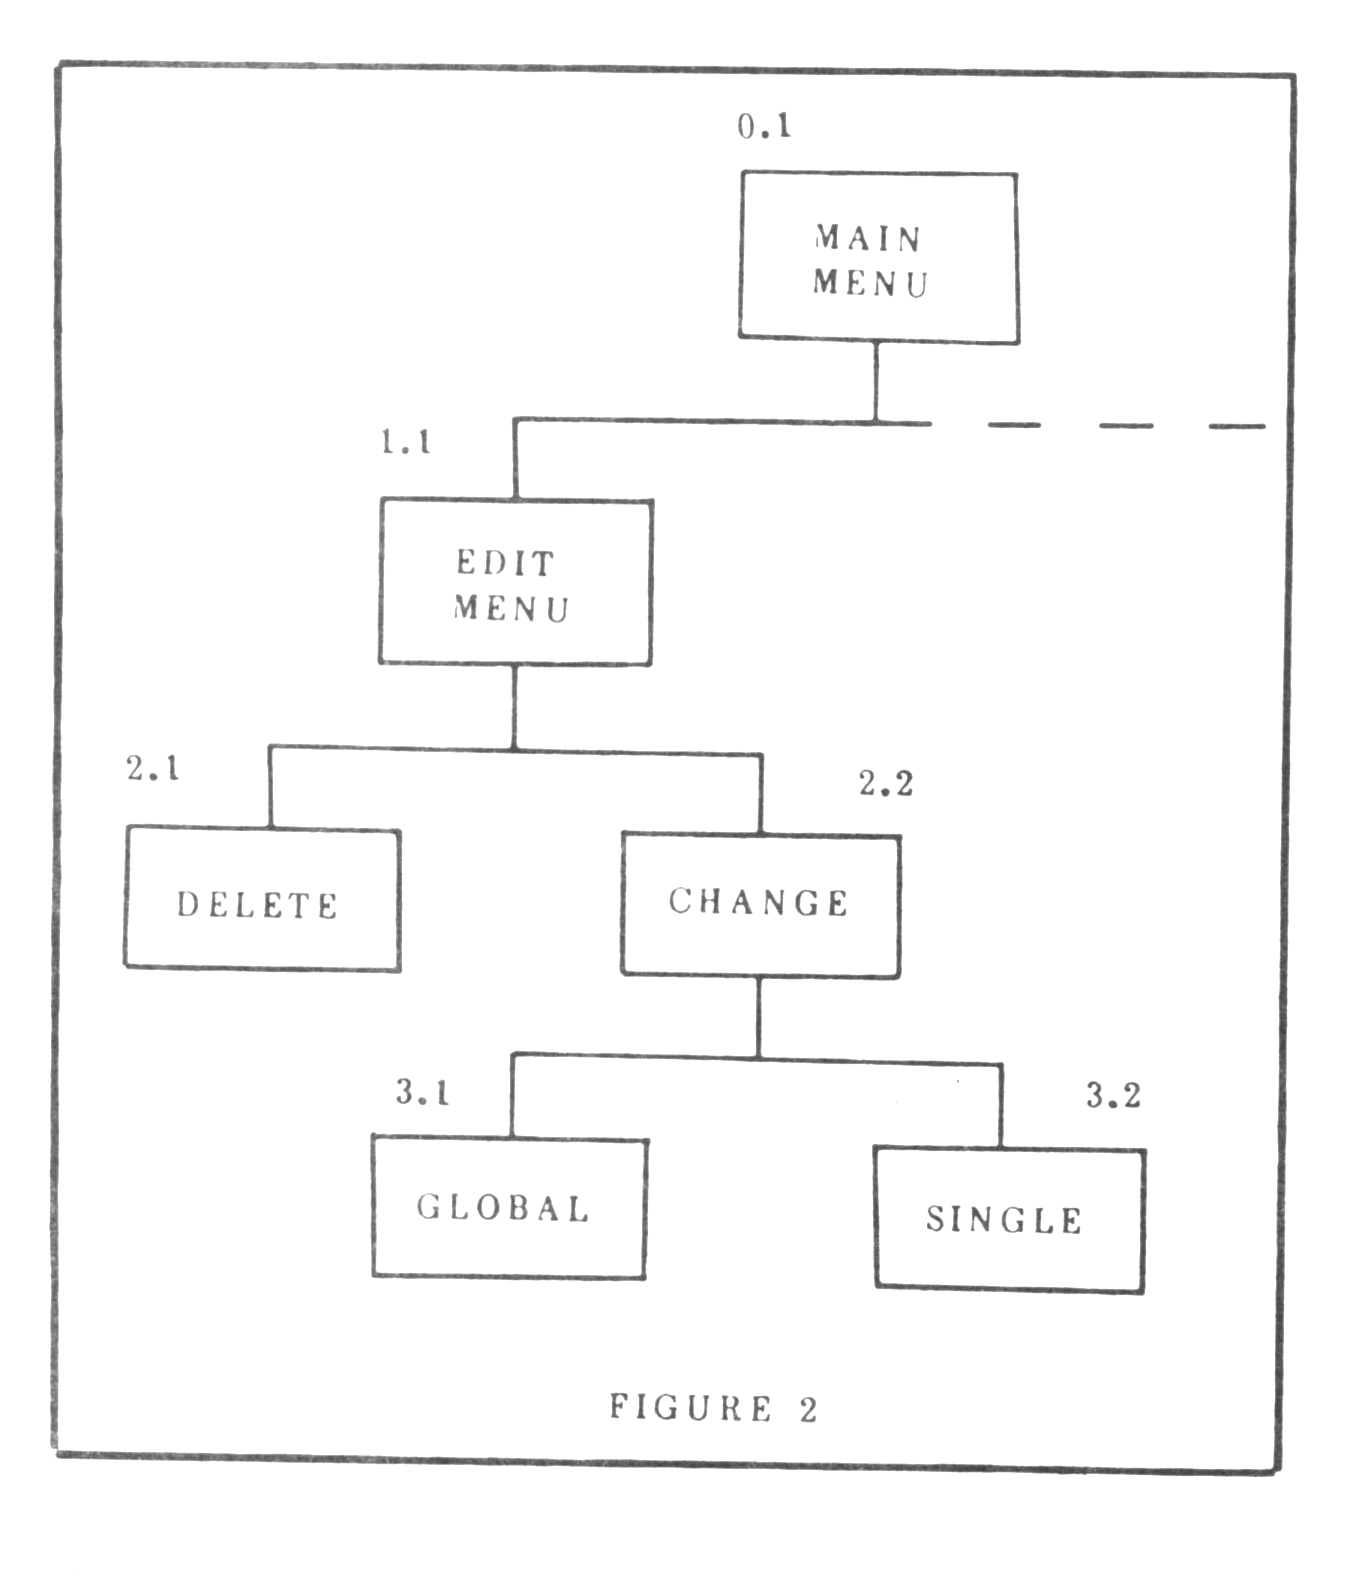
A tool exists to show the structure of a program. The accepted name for this tool is “structure chart”. Figure 2 presents a partial structure chart of a hypothetical word processing program. Take a look at it, and then continue.
Notice that the main menu (0.1) can pass control to the edit routine (1.1) and that the edit routine can then pass control to either delete (2.1) or change (2.2) routines. If the delete routine is chosen, it “does its thing” and then passes control back to the edit routine (1.1).
Now, pay close attention. If the delete routine were to pass control to routine 2.2 instead of passing back to the edit routine, you have half of a loop formed. If 2.2 passed back to 2.1 and 2.1 returned to 2.2 you would have a loop that could go on until you pressed the BREAK key. This would be POOR STRUCTURE, and very frustrating besides. That is why you see a nice series of vertical lines which meet the horizontal lines between each level. Please note here that the horizontal lines serve merely to show that the modules they each connect are on the same level, not that they are designed to call each other.
Structured Numbering
Structure charts have NO relation to line numbers assigned for each routine. However, some relationship between function and number would be handy if you plan to do a great deal of programming.
As an example, I use 10-100 for any DIM or LET statements needed for the program. Usually, 101-200 are reserved for the central program loop which houses the main menu and input routine(s). I also tend to use 7000-7099 for read utility routines, 8000-8299 for write utility routines, and 9000+ for termination routines. The numbers in between are used in order of level, from high to low. I also number in increments of 10 on the first program pass to allow lots of room for insertions due to minor logic gaps and errors. You may do as you please, but some system would make locating problems much simpler.
This was short, but I hope also sweet. We will explore more examples next time, when we will study the techniques of using a tool called a flow chart. For those of you not familiar with the term, flow charting outlines the details of logic you plan to use before you enter any BASIC at all. Why? Flow charts help to figure out what went wrong when the machine does not do what you expect.
John is 32 years old and resides in Michigan. He is currently seeking employment in the Data Processing field. His system is composed of a TS1000, Memotech CIF, dual Aerco disk drives, a letter quality and a dot-matrix printer, and 64K of RAM. This article was produced with disk-based Memotext.