
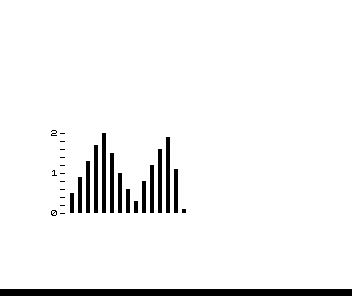
A compact bar chart for the 8K ROM. Enter up to 15 values between 0 and 2000; the program draws a scale on the left marked 0, 1 and 2 (thousands) and PLOTs each value as a vertical bar, with each pixel standing for 100. It stops at the first value of 0.
To change a value, enter LET B(A)=(new value) and then GOTO 1, not RUN. The article explains how to change the pixel range in line 90, the spacing in line 100, and the size of the array.
Published in Syntax January 1982 (Bar Chart).
Image Gallery
Source Code
   1 DIM B(15)
   2 FOR X=1 TO 15
   3 INPUT B(X)
   4 NEXT X
  10 REM BAR CHART (0-2000)
  20 FOR A=11 TO 21
  30 PRINT AT A,1;"-"
  40 NEXT A
  50 PRINT AT 11,0;"2";AT 16,0;"1";AT 21,0;"0"
  60 FOR A=1 TO 15
  70 FOR P=1 TO 43
  80 IF B(A)=0 THEN STOP
  90 IF B(A)<P*100-50 THEN GOTO 120
 100 PLOT A*2+3,P
 110 NEXT P
 120 NEXT A
 130 REM INPUT B(A)
Note: Type-in program listings on this website use ZMAKEBAS notation for graphics characters.