
RUN shows a title, then asks INPUT NUM OF SEG: and a value for each segment. The program draws the circle in FAST mode, then the radii in SLOW mode, and prints a table of each segment’s value and its share in percent, with the total. It needs 16K.
The article suggests COPY to print the chart. GOTO 970 saves the program so that it starts itself when loaded. It is a reworking of Ron Oblander’s Pie Chart Graph and Display from November 1982.
Published in Syntax November 1983 (Pie Chart: A Refinement).
Image Gallery
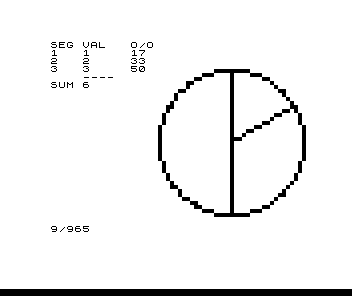
Source Code
   1 LET N0=0
   2 PRINT AT 10,N0;"PIECHART FOR UP TO 18 SEGMENTS"
   3 PAUSE 200
   4 CLS
   6 LET T=N0
   8 LET R=18
  10 LET Q=45
  12 LET W=N0
  15 PRINT " INPUT NUM OF SEG:"
  20 INPUT C
  22 DIM E(C)
  26 FOR I=1 TO C
  41 PRINT " THEN INPUT VAL FOR SEG ";I;":"
  42 INPUT E(I)
  45 CLS
  57 LET T=T+E(I)
  59 NEXT I
 100 FAST
 105 PLOT Q,R
 120 FOR P=N0 TO 6.3 STEP 0.056
 140 PLOT Q+SIN P*R,R+COS P*R
 200 NEXT P
 205 PRINT AT N0,N0;"SEG";TAB 4;"VAL ";TAB 10;"O/O"
 217 SLOW
 220 FOR I=1 TO C
 230 LET Z=E(I)*2*PI/T
 405 LET W=Z+W
 410 LET M=SIN W
 420 LET N=COS W
 560 FOR J=N0 TO R
 570 PLOT Q+M*J,R+N*J
 580 NEXT J
 920 PRINT AT I,N0;I;TAB 4;E(I);TAB 10;INT (E(I)*100/T+0.5)
 930 NEXT I
 960 PRINT TAB 4;"----";TAB N0;"SUM ";T
 965 STOP
 970 SAVE "PIECHART"
 980 RUN
Note: Type-in program listings on this website use ZMAKEBAS notation for graphics characters.