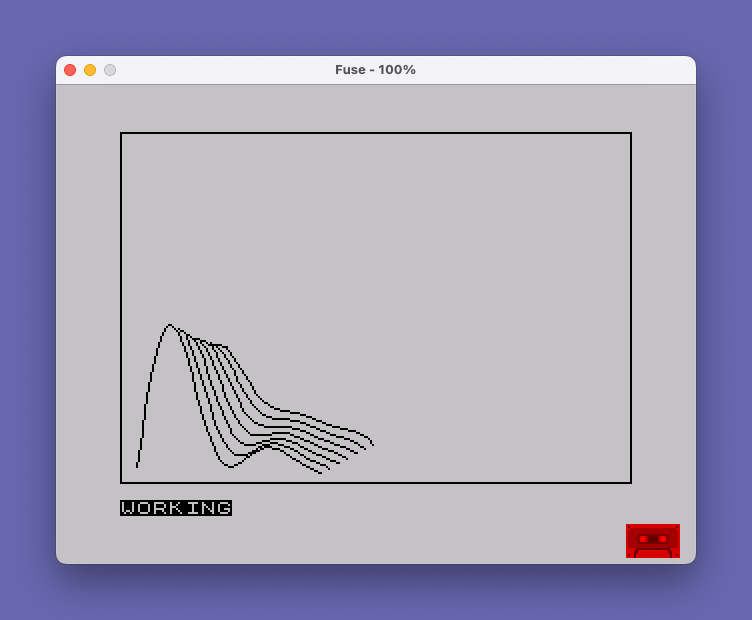
This program renders a 3D perspective surface plot of the function Z = SIN(Y/F)·(X−Y)²/150 using a hidden-line algorithm on a 256×176 pixel display. It projects the X–Y domain onto the screen using isometric-style angle parameters PHI and PSI, maintaining a horizon array H(280) that tracks the topmost plotted screen Y coordinate for each pixel column to suppress hidden lines. The user can optionally enable crosshatching, which adds a second rendering pass with lines running in the perpendicular grid direction. Originally written for the Apple II and converted to the TS-2068, the program was downloaded from the BYTE Magazine BBS. The main plot loop uses DRAW commands between adjacent horizon points rather than individual PLOTs, producing connected line segments for smooth curve rendering.
Program Analysis
Program Structure
The program is organized into four logical sections accessed via GO TO and GO SUB:
- Lines 10–200: Subroutine — plots X-direction scan lines with hidden-line removal.
- Lines 210–390: Subroutine — plots Y-direction scan lines (crosshatch pass).
- Lines 400–510: Initialization — sets up all parameters, arrays, and constants.
- Lines 520–690: Main program — handles user input, optional axes, border, and the rendering loop.
Execution begins at line 10, which immediately jumps to VAL "410" (the initialization block), then the main loop calls the two subroutines as needed.
Hidden-Line Algorithm
The core technique is a floating horizon (scan-line) hidden-surface algorithm. A one-dimensional array H(280) stores the minimum screen Y value ever plotted for each screen X column. Before plotting any point, the program checks whether the candidate screen Y (YB) is less than the stored horizon value H(XB); if so, it updates the horizon and eventually draws the visible segment. This ensures that parts of the surface farther from the viewer (lower on screen in this projection) are suppressed once a nearer surface feature has been drawn at that column.
The horizon array is re-initialized to 189 at the start of each rendering pass (line 630), which is safely above the 176-line display height, allowing all first-encountered points through.
3D Projection
The oblique projection uses two angles, PHI (0.5 radians) and PSI (0.4 radians), pre-computed into four constants at line 500:
| Variable | Meaning |
|---|---|
CF | COS PHI — X-axis screen X scaling |
SF | SIN PHI — X-axis screen Y scaling |
CP | COS PSI — Y-axis screen X scaling |
SP | SIN PSI — Y-axis screen Y scaling |
Screen coordinates are computed as XB = XO + X*CF − Y*CP and YB = YO − X*SF − Y*SP − Z, giving an isometric-style oblique view with the origin at (100, 170).
The Plotted Function
The surface function is defined using a DEF FN at line 10: FN Y(X) = SIN(Y/F) * (X−Y)² / 150. Note that this function uses both the formal parameter X and the global variable Y — the outer loop variable — making it context-dependent rather than a pure function. F is set to 10 at line 480, controlling the frequency of the sinusoidal component. The result is clipped to a maximum of H (the computed horizon cutoff at line 510) to prevent drawing above a defined ceiling.
Rendering Passes and Crosshatching
The variable CH controls how many passes the loop at lines 620–670 executes. Without crosshatching CH=1 and only the X-direction subroutine (line 20) is called. With crosshatching CH=2, both subroutines run. Each pass independently resets the horizon array, so the second pass (Y-direction lines) does not inherit hidden-line state from the first.
The step size T (initialized to 5 at line 460) controls the spacing between drawn grid lines in each pass. Only every T-th line is drawn; intermediate lines only update the horizon array to maintain correct hidden-line suppression.
Drawing Method
Rather than plotting individual pixels, the final drawing loops (lines 180–200 and 370–390) use PLOT followed by DRAW between adjacent horizon entries. For each column K in the visible range, a DRAW connects (K, 175−H(K)) to (K+1, 175−H(K+1)), producing a continuous polyline. The coordinate flip 175−H(K) converts from the internal top-down convention to the display’s bottom-up Y axis.
Key BASIC Idioms and Techniques
GO TO VAL "410"at line 10 — a memory-saving idiom that avoids storing the line number as an integer literal in the BASIC token stream.DEF FNusing a global loop variable (Y) alongside its formal parameter — an intentional coupling that allows the function to vary along both grid axes.PRINT #0;"WORKING"(line 640) — prints to the lower status line area during computation to indicate progress without disturbing the graphics area.- Pre-computing trigonometric values into
CF,SF,CP,SPat initialization avoids repeated SIN/COS calls in the inner loops. - The border rectangle is drawn at line 610 using a chain of
DRAWcommands from a singlePLOT, efficiently outlining the 256×176 screen.
Notable Anomalies
- Line 390 and 200 use lowercase
kandxinNEXT k: NEXT x. In Sinclair BASIC, variable names are case-insensitive in practice on this platform; these match the uppercase loop variables and function correctly. - The domain bounds mix origins:
XL=0,XR=YO=170,YL=XL=0,YR=XO=100, meaning the plotted surface spans a 170×100 unit grid — an asymmetric domain that widens the X extent relative to Y. - The horizon array is dimensioned as
H(280)(indices 1–280) but screen X spans 0–255. The extra headroom prevents out-of-bounds errors from rounding in the projection for large coordinate values near the domain edges.
Content
Image Gallery
Source Code
   10 CLS : DEF FN Y(X)=SIN (Y/F)*(X-Y)*(X-Y)/150: GO TO VAL "410"
   20 REM *PLOTTING
   30 LET Y=YL
   40 FOR X=XL TO XR
   50 LET XB=INT (XO+X*CF-Y*CP+.5)
   60 LET Z=FN Y(X): IF Z>H THEN LET Z=H
   70 LET YB=INT (YO-X*SF-Y*SP-Z+.5)
   80 IF YB<H(XB) THEN LET H(XB)=YB
   90 NEXT X
  100 FOR X=XL TO XR STEP T
  110 LET U=XO+X*CF: LET V=YO-X*SF
  120 FOR Y=YL TO YR
  130 LET XB=INT (U-Y*CP+.5)
  140 LET Z=FN Y(X): IF Z>H THEN LET Z=H
  150 LET YB=INT (V-Y*SP-Z+.5)
  160 IF YB<H(XB) THEN LET H(XB)=YB
  170 NEXT Y
  180 FOR K=INT (U-YR*CP+.5) TO INT (U-YL*CP+.5)-1
  190 PLOT K,175-(H(K)): DRAW (K+1)-K,(175-(H(K+1)))-(175-(H(K)))
  200 NEXT k: NEXT x: RETURN
  210 REM *PLOTTING CROSSHATCH
  220 LET X=XL
  230 FOR Y=YL TO YR
  240 LET XB=INT (XO+X*CF-Y*CP+.5)
  250 LET Z=FN Y(X): IF Z>H THEN LET Z=H
  260 LET YB=INT (YO-X*SF-Y*SP-Z+.5)
  270 IF YB<H(XB) THEN LET H(XB)=YB
  280 NEXT Y
  290 FOR Y=YL TO YR STEP T
  300 LET U=XO-Y*CP: LET V=YO-Y*SP
  310 FOR X=XL TO XR
  320 LET XB=INT (U+X*CF+.5)
  330 LET Z=FN Y(X): IF Z>H THEN LET Z=H
  340 LET YB=INT (V-X*SF-Z+.5)
  350 IF YB<H(XB) THEN LET H(XB)=YB
  360 NEXT X
  370 FOR K=INT (U+XL*CF+.5) TO INT (U+XR*CF)-1
  380 PLOT K,175-(H(K)): DRAW (K+1)-K,(175-(H(K+1)))-(175-(H(K)))
  390 NEXT k: NEXT x: RETURN
  400 REM  MAIN PROGRAM
  410 DIM H(280)
  420 LET XO=100: LET YO=170
  430 LET PHI=.5: LET PSI=.4
  440 LET XL=0: LET XR=YO
  450 LET YL=XL: LET YR=XO
  460 LET T=5
  470 REM PLOT FUNCTION
  480 LET F=10
  490 REM ABBREVIATIONS AND CUTTING THE TOP
  500 LET CF=COS PHI: LET SF=SIN PHI: LET CP=COS PSI: LET SP=SIN PSI
  510 LET H=YO-XR*SF-YR*SP-2
  520 INPUT "DO YOU DESIRE CROSSHATCHING? Y/N";T$
  530 LET CH=1
  540 IF T$="Y" OR T$="y" THEN LET CH=2
  550 INPUT "DO YOU WISH TO VIEW THE AXES?   (Y/N)";T$
  560 IF T$="N" OR T$="n" THEN GO TO 610
  570 LET A=XO+XL*CF: LET B=175-(YO-XL*SF): LET C=XO+XR*CF: LET D=175-(YO-XR*SF)
  580 PLOT A,B: DRAW C-A,D-B
  590 LET A=XO-YL*CP: LET B=175-(YO-YL*SP): LET C=XO-YR*CP: LET D=175-(YO-YR*SP)
  600 PLOT A,B: DRAW C-A,D-B
  610 PLOT 0,0: DRAW  0,175: DRAW 255,0: DRAW 0,-175: DRAW -255,0
  620 FOR R=1 TO CH
  630 FOR I=1 TO 280: LET H(I)=189: NEXT I
  640 PRINT #0;"WORKING"
  650 IF R=1 THEN GO SUB 20
  660 IF R=2 THEN GO SUB 210
  670 NEXT R: STOP
  680 REM CONVERTED FROM APPLE II TO TS-2068 BY T.A.KNYSZEK
  690 REM  DOWN LOADED FROM BYTE MAGAZINE'S BBS
Note: Type-in program listings on this website use ZMAKEBAS notation for graphics characters.