
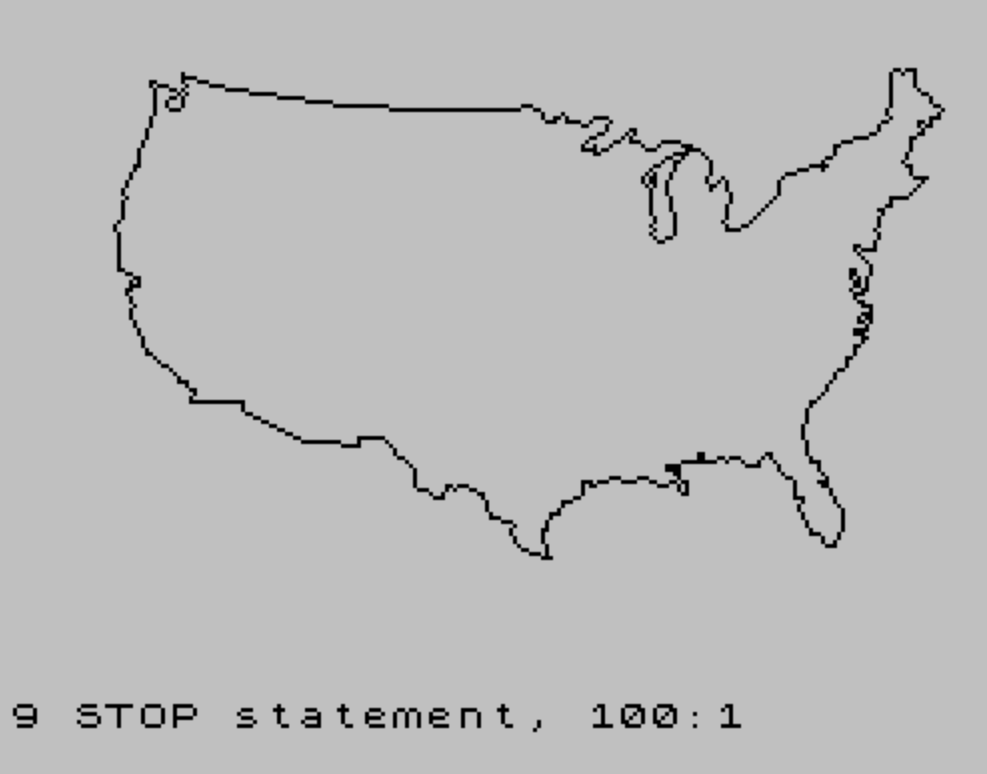
This program draws an outline map of the contiguous United States using relative DRAW commands read sequentially from DATA statements. Starting from a fixed PLOT coordinate at (36,146), the program reads pairs of delta-x and delta-y values from lines 30–49 and issues DRAW commands to trace the coastline and borders incrementally. The map data is terminated by a sentinel pair of 0,0, which redirects execution to STOP at line 100. The entire outline is encoded as a long chain of small integer offsets, a compact technique for storing vector graphics in BASIC DATA statements.
Program Structure
The program is organized into three logical sections:
- Initialization (line 5): A single
PLOT 36,146sets the starting pen position for the map outline. - Drawing loop (lines 10–25): A tight loop reads pairs of values from DATA and issues
DRAWcommands. Termination is detected when both values equal zero. - Data block (lines 30–50): All coordinate deltas are stored as comma-separated integer pairs across lines 30–50, ending with the sentinel
0,0.
Drawing Loop
The core loop is minimal and efficient:
READ a:READ b(line 10) — fetches the next delta-x and delta-y values.DRAW a,b(line 15) — draws a line segment relative to the current pen position.IF a=0 AND b=0 THEN GO TO 100(line 20) — sentinel check; the pair0,0at line 50 terminates the loop and branches toSTOP.GO TO 10(line 25) — unconditional back-branch to continue reading.
Because DRAW operates in relative coordinates, each data pair represents a vector step rather than an absolute screen position, making the encoding compact. The entire US coastline and border outline is stored as hundreds of small integer offsets.
Data Encoding
The map data spans lines 30–50 and contains delta pairs with values typically in the range −15 to +23. Larger jumps (e.g., 23,0 and -15,8 visible in lines 30 and 47) correspond to long straight or near-straight sections such as the northern border with Canada. Negative x-values move left and negative y-values move down on screen, consistent with the coordinate system used.
The data is organized so that drawing proceeds continuously from the starting point without lifting the pen, tracing the perimeter as a single connected polyline. This means the map is rendered as a single unbroken outline rather than separate state or region segments.
Key BASIC Idioms
- Sentinel-terminated DATA: The
0,0pair at line 50 acts as an end-of-data marker, avoiding the need to know or compute the total number of data points in advance. - Dual READ on one line:
READ a:READ buses the colon separator to fetch both values of a pair on a single logical line, keeping the loop compact. - PLOT then DRAW chain: A single
PLOTat line 5 initializes the pen; all subsequent movement is viaDRAW, which implicitly uses the last plotted position.
Notable Details and Potential Issues
Line 35 has a leading space before DATA — this is syntactically valid but slightly inconsistent with the other data lines. It does not affect execution.
There is no error handling for a DATA exhaustion condition other than the sentinel check. If the 0,0 pair were accidentally removed or corrupted, the program would raise an Out of DATA error rather than stopping cleanly.
The starting coordinate PLOT 36,146 is fixed, so the map is drawn at a specific position on screen. No scaling or centering logic is present; the map dimensions are entirely determined by the accumulated delta values in the DATA lines.
Program Metrics
| Item | Value |
|---|---|
| Data lines | 21 (lines 30–50) |
| Starting position | (36, 146) |
| Termination sentinel | 0, 0 (line 50) |
| Loop lines | 10, 15, 20, 25 |
| Machine code used | None |
Image Gallery
Source Code
   1 REM U.S.MAP
   5 PLOT 36,146
  10 READ a:READ b
  15 DRAW a,b
  20 IF a=0 AND b=0 THEN GO TO 100
  25 GO TO 10
  30 DATA 1,-1,2,0,2,-1,1,-1,-1,-1,-1,0,-1,-1,0,-1,1,-1,2,0,1,1,0,2,1,1,-1,1,1,1,-1,1,0,2,2,-1,3,-1,3,-1,5,-1
  31 DATA 8,-1,6,-1,7,-1,8,-1,19,-1,23,0,2,1,1,0,2,-1,1,-2,1,-1,2,0,0,1,1,0,1,1,1,-2,3,0,2,-1,2,2
  32 DATA 3,0,1,-1,-1,-2,-2,-1,-3,-2,-1,-2,2,0,1,1,0,-2,1,0,3,2,2,1,3,3,1,0,0,-1,-1,-1,0,-1,2,0
  33 DATA 2,-2,2,0,2,2,4,0,1,-1,2,0,0,-1,-1,-1,-3,0,-3,-2,-2,-1,-2,-2,-1,-2,1,-1,2,3,0,-2,-1,-4
  34 DATA 0,-4,1,-2,-1,-1,1,-1,-1,-1,2,-2,1,0,3,2,0,4,-1,3,-1,6,1,2,1,1,0,2,1,0,1,2,1,0
  35  DATA 0,2,3,-1,2,-2,1,-1,0,-2,-1,-3,1,-2,2,2,1,1,1,-1,0,-2,1,-2,-1,-4,0,-1,-1,-1,1,-2
  36 DATA 3,0,3,2,6,6,1,2,0,2,2,2,5,1,2,1,3,0,-1,-1,0,2,3,2,0,2,10,3,1,2,3,2,-1,1,0,1,1,1,0,8
  37 DATA 1,1,1,0,1,-1,1,1,2,0,0,-4,4,-3,0,-1,2,-1,1,-1,-1,-2,-2,0,0,-2,-3,1
  38 DATA 1,-3,-3,-1,0,-3,-1,-2,-1,-1,2,-1,0,-2,2,-1,2,0,-5,-5,-4,0,0,-2,-3,-1,1,-1,-1,-1,0,-2
  39 DATA -1,-1,1,-2,-1,-2,0,-1,-2,0,-3,1,0,-1,3,-3,1,-2,0,-1,-1,-1,0,-3,-1,-1,-1,4,-1,1,0,1,-1,0,0,-2
  40 DATA 1,-2,-1,-1,2,-1,-1,-1,1,-1,1,0,0,-1,2,0,0,-2,-2,0,-1,-1,0,-1,3,1,-1,-3,-3,0,0,-1,2,0,0,-1
  41 DATA 1,0,-2,-2,-1,0,0,-2,-2,-1,0,-2,-2,-1,-2,-3,-1,-2,-3,-3,-1,0,-1,-3,0,-2,-1,-1,0,-3,1,-1,0,-2
  42 DATA 1,-3,2,0,0,-2,2,-2,0,-1,-2,0,3,-2,0,-1,2,-3,1,-2,0,-4,-1,-2,-1,-2,-2,0
  43 DATA -2,3,-2,0,-1,3,-1,1,0,1,-1,2,1,2,-2,0,0,4,-3,2,-2,3,-1,2,-1,0,-2,-2,0,-1,-3,0,-2,2,-2,0,-1,-1
  44 DATA -1,1,-1,0,-1,-1,-3,0,0,2,-1,0,0,-2,-4,0,-1,-1,-3,0,0,-1,2,0,0,-1,1,1,0,-2,2,-1,0,-3,-1,0,-1,2,-2,1
  45 DATA -1,-1,-2,0,-3,2,-2,0,-2,-1,-2,0,-2,1,-4,-1,-2,-1,0,1,-2,0,0,-3,-3,-2,-2,0,-1,-3,-2,0,-1,-4,-1,0,0,-3
  46 DATA 1,-1,0,-2,1,-1,-2,0,-2,1,-3,1,-2,2,0,1,-1,1,0,1,1,1,-2,1,-4,1,-1,3,-1,3,-3,1,-2,1,-1,0,-1,-1,-1,1
  47 DATA -1,0,-1,-3,-2,0,-2,2,-2,0,-1,2,0,3,-2,2,-2,1,-2,3,-2,2,-6,0,0,-2,-10,1,-4,0,-15,8,0,2,-13,0
  48 DATA 0,1,1,1,0,1,-1,0,-1,2,-2,0,0,1,-2,2,-3,2,-1,1,-2,1,-1,3,-1,3,-2,3,0,2,1,1,-2,3,0,1,1,0,0,2,2,-1,0,2
  49 DATA -1,0,-4,2,0,9,-1,2,2,2,0,4,1,1,-1,2,2,4,1,2,1,0,0,3,2,5,2,6,0,5,-1,2
  50 DATA 0,0
 100 STOP
Note: Type-in program listings on this website use ZMAKEBAS notation for graphics characters.