
I hate to say it, but when my friend Andy Gippetti bought a Timex/Sinclair 2068, I thought that he was crazy. I mean, Timex had just given up on it and there were so many other, more popular 8 bit computers on the market at the time. But $99 for a color computer with 72K of memory did seem like a good price so I bought one too. And after selling every bit of Atari equipment I owned, I am here to tell you that it is by far the best 8 bit computer I have ever used.
But of course, the one tradeoff in using my 2068 is that there is very little software for it. This, too, has turned into a blessing. I now make my own software.
Being a Quality Assurance Engineer, alot of my work has to do with statisics. These statisics have to be represented in a form that will show the top management in my company the good as well as the bad trends in our production line. But the question was, can the T/S 2068 compete in the hi-tech bussiness place with the likes of I.B.M. and Apple. Well I’m here to tell you the answer is yes.
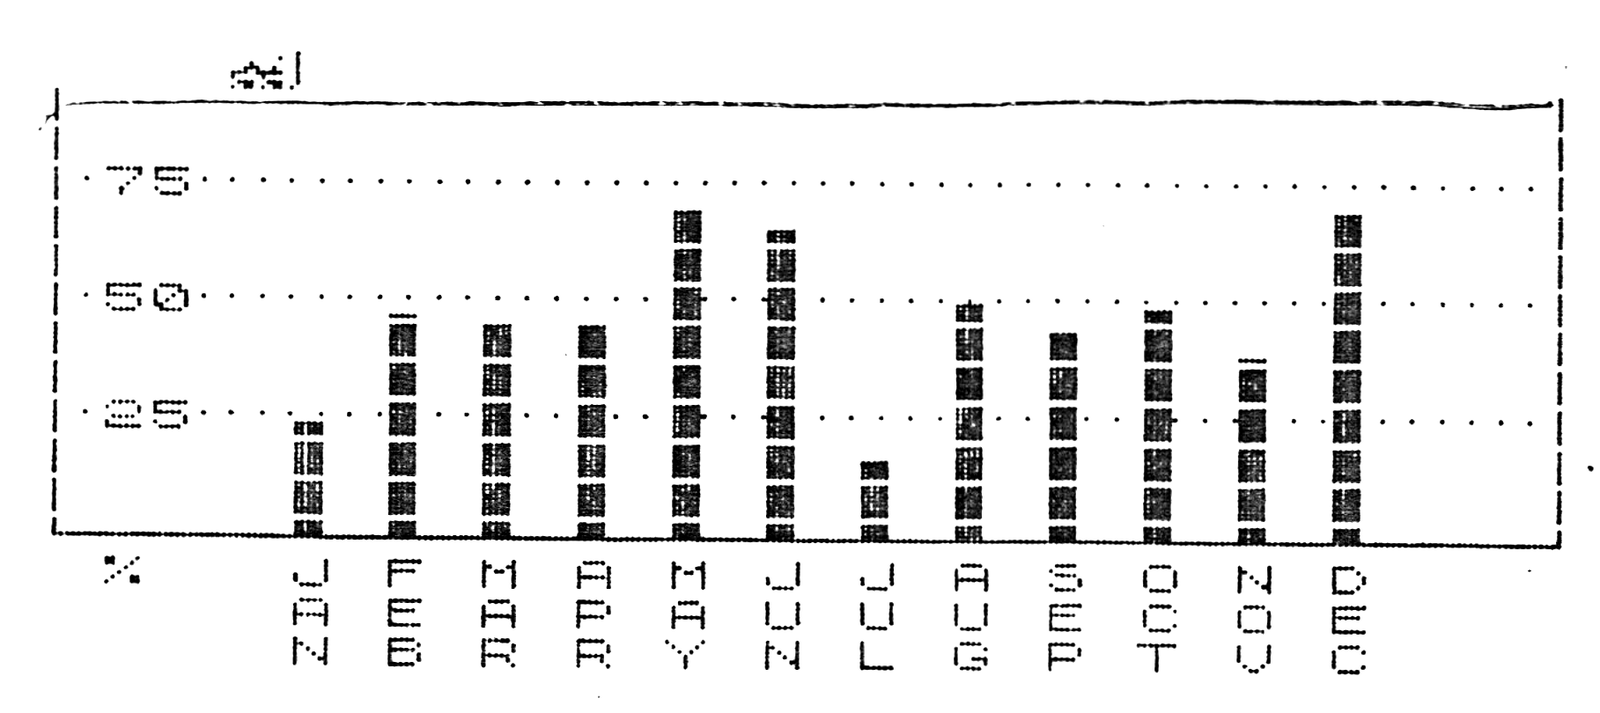
The program below will display a bargraph or a linegraph that will display actual, accurate data. It is not one of those bargraph programs that use the graphic symbol “1” and stack them one on top of another to give the illusion of actual data. If you input 62%, either graph will accurately represent 62%.
This program is a subroutine for alot of my bussiness programs that I use in my job. But it can also be used for programs which track home spending as well as uses in whatever programs you write that need to display data graphiclly.
The program is self-explanitory. Just follow the rem statments in the program to discover how to customize it to your programs. If there are any questions or improvements to my program please drop me a line at:
John Gaddis
[address omitted]
Mastic Beach N.Y. 11951
   5 DIM i(12): DIM t(3): DIM r(12)
   6 LET n=0: LET x=0: LET l=0: LET e=0: LET i=0
  10 BORDER 0: PAPER 0: INK 7
  11 CLS
  20 PRINT AT 11,2;"Do you want new data (Y/N)"
  30 IF INKEY$="y" THEN GO TO 50
  40 IF INKEY$="n" THEN GO TO 3000
  44 GO TO 30
  50 CLS
  55 PRINT AT 11,0;"How many numbers for graph?"
  60 INPUT t
  65 IF t>12 THEN GO TO 200
 100 CLS
 110 FOR x=n+1 TO t
 120 LET l=x
 142 PRINT AT 0,10;"Enter Data"
 145 PRINT AT 2,6;"Input number ";x
 150 INPUT i(x)
 160 PRINT AT 5+l,0;l,i(x)
 165 NEXT x
 170 PRINT AT 20,0;"Are these numbers correct (Y/N)"
 180 IF INKEY$="y" THEN GO TO 3000
 185 IF INKEY$="n" THEN GO TO 100
 190 GO TO 180
 200 PRINT AT 11,0;"You can only input 12 numbers"
 210 PAUSE 200
 220 GO TO 50
1000 CLS
1005 PLOT 24,75: DRAW 216,0
1010 PLOT 24,175: DRAW 216,0
1020 PLOT 24,75: DRAW 0,100
1030 PLOT 240,75: DRAW 0,100
1040 FOR b=100 TO 148 STEP 24
1050 PLOT 24,b
1060 DRAW 216,0
1070 NEXT b
1080 FOR d=44 TO 220 STEP 16
1090 PLOT d,75
1100 DRAW 0,100
1110 NEXT d
1114 PLOT 24,75
1115 DRAW 20,i(1)
1120 FOR w=2 TO t
1150 LET r(w)=i(w)-i(w-1)
1160 DRAW 16,r(w)
1165 IF w=12 THEN GO TO 1200
1170 NEXT w
1200 GO SUB 3600
1999 GO TO 3005
2000 CLS
2005 PLOT 0,75: DRAW 255,0
2010 PLOT 0,175: DRAW 255,0
2020 PLOT 0,75: DRAW 0,100
2030 PLOT 255,75: DRAW 0,100
2040 FOR x=100 TO 148 STEP 24
2060 FOR y=0 TO 255 STEP 5
2070 PLOT y,x
2080 NEXT y
2090 NEXT x
2130 LET c=0
2150 FOR j=40 TO 232 STEP 16
2190 LET c=c+1
2195 IF c=t THEN GO TO 2555
2200 FOR z=1 TO 5
2205 PLOT j+z,75
2405 DRAW 0,i(c)
2455 NEXT z
2505 NEXT j
2600 GO SUB 3600
2999 GO TO 3005
3000 CLS
3005 PRINT AT 20,0;"Pick graph to be displayed"
3010 PRINT "a.Linegraph  b.Bargraph  c.End"
3030 IF INKEY$="a" THEN GO TO 1000
3040 IF INKEY$="b" THEN GO TO 2000
3045 IF INKEY$="c" THEN GO TO 3500
3048 IF INKEY$="x" THEN STOP
3050 GO TO 3030
3500 SAVE "xxx" LINE 20
3501 STOP
3600 PRINT AT 9,1;"25": PRINT AT 6,1;"50": PRINT AT 3,1;"75": PRINT AT 13,1;"%"
3610 PRINT AT 13,5;"J F M A M J J A S O N D"
3620 PRINT AT 14,5;"A E A P A U U U E C O E"
3630 PRINT AT 15,5;"N B R R Y N L G P T V C"
3900 RETURN
4000 FOR t=1 TO 12
4010 PRINT i(t)
4020 NEXT t
Media
Note: Type-in program listings on this website use ZMAKEBAS notation for graphics characters.