
Draws a line graph or a bar graph of up to twelve percentages, labelled by month, with one pixel for each percent. John Gaddis wrote it as a subroutine for business programs on the TS2068.
RUN it and answer y for new data (lower case), enter how many numbers and then the numbers, from 0 to 100, and choose a or b. Choice c saves the program with its data. The bar graph, as printed, does not draw the last value entered.
Published in LISTing May – June 1985 (Business Graphics).
Image Gallery
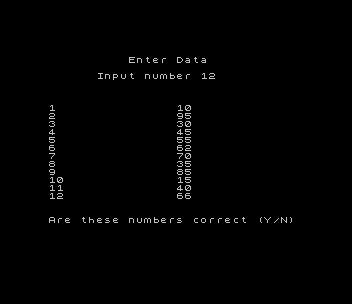
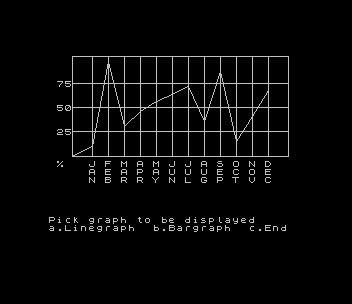
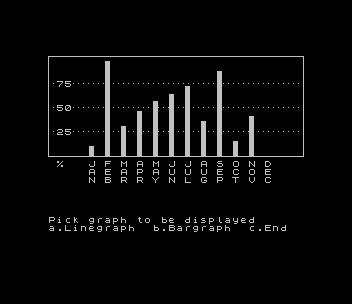
Source Code
   5 DIM i(12): DIM t(3): DIM r(12)
   6 LET n=0: LET x=0: LET l=0: LET e=0: LET i=0
  10 BORDER 0: PAPER 0: INK 7
  11 CLS
  20 PRINT AT 11,2;"Do you want new data (Y/N)"
  30 IF INKEY$="y" THEN GO TO 50
  40 IF INKEY$="n" THEN GO TO 3000
  44 GO TO 30
  50 CLS
  55 PRINT AT 11,0;"How many numbers for graph?"
  60 INPUT t
  65 IF t>12 THEN GO TO 200
 100 CLS
 110 FOR x=n+1 TO t
 120 LET l=x
 142 PRINT AT 0,10;"Enter Data"
 145 PRINT AT 2,6;"Input number ";x
 150 INPUT i(x)
 160 PRINT AT 5+l,0;l,i(x)
 165 NEXT x
 170 PRINT AT 20,0;"Are these numbers correct (Y/N)"
 180 IF INKEY$="y" THEN GO TO 3000
 185 IF INKEY$="n" THEN GO TO 100
 190 GO TO 180
 200 PRINT AT 11,0;"You can only input 12 numbers"
 210 PAUSE 200
 220 GO TO 50
1000 CLS
1005 PLOT 24,75: DRAW 216,0
1010 PLOT 24,175: DRAW 216,0
1020 PLOT 24,75: DRAW 0,100
1030 PLOT 240,75: DRAW 0,100
1040 FOR b=100 TO 148 STEP 24
1050 PLOT 24,b
1060 DRAW 216,0
1070 NEXT b
1080 FOR d=44 TO 220 STEP 16
1090 PLOT d,75
1100 DRAW 0,100
1110 NEXT d
1114 PLOT 24,75
1115 DRAW 20,i(1)
1120 FOR w=2 TO t
1150 LET r(w)=i(w)-i(w-1)
1160 DRAW 16,r(w)
1165 IF w=12 THEN GO TO 1200
1170 NEXT w
1200 GO SUB 3600
1999 GO TO 3005
2000 CLS
2005 PLOT 0,75: DRAW 255,0
2010 PLOT 0,175: DRAW 255,0
2020 PLOT 0,75: DRAW 0,100
2030 PLOT 255,75: DRAW 0,100
2040 FOR x=100 TO 148 STEP 24
2060 FOR y=0 TO 255 STEP 5
2070 PLOT y,x
2080 NEXT y
2090 NEXT x
2130 LET c=0
2150 FOR j=40 TO 232 STEP 16
2190 LET c=c+1
2195 IF c=t THEN GO TO 2555
2200 FOR z=1 TO 5
2205 PLOT j+z,75
2405 DRAW 0,i(c)
2455 NEXT z
2505 NEXT j
2600 GO SUB 3600
2999 GO TO 3005
3000 CLS
3005 PRINT AT 20,0;"Pick graph to be displayed"
3010 PRINT "a.Linegraph  b.Bargraph  c.End"
3030 IF INKEY$="a" THEN GO TO 1000
3040 IF INKEY$="b" THEN GO TO 2000
3045 IF INKEY$="c" THEN GO TO 3500
3048 IF INKEY$="x" THEN STOP
3050 GO TO 3030
3500 SAVE "xxx" LINE 20
3501 STOP
3600 PRINT AT 9,1;"25": PRINT AT 6,1;"50": PRINT AT 3,1;"75": PRINT AT 13,1;"%"
3610 PRINT AT 13,5;"J F M A M J J A S O N D"
3620 PRINT AT 14,5;"A E A P A U U U E C O E"
3630 PRINT AT 15,5;"N B R R Y N L G P T V C"
3900 RETURN
4000 FOR t=1 TO 12
4010 PRINT i(t)
4020 NEXT t
Note: Type-in program listings on this website use ZMAKEBAS notation for graphics characters.